Chapter 24. Listeners
Listeners can be seen as hooks. They wait for a specific event and take a used-defined action if the event occurs.
Created listeners are shown in the Event Listener list (see Figure below). The list has the following columns:
Table 24.1. Event Listeners Table Description
| Column name | Description |
|---|---|
| Listener type | Shows the graphic representation of each listener type. |
| Name | Show the name of the listener. |
| Event source description | Describes the event the listener is waiting for. |
| Task type | Shows the graphic representation of each task type. |
| Task description | Describes the task that will be activated if the set event occurs. |
| Monitoring details | Shows detailed monitoring information. By default, the column is collapsed
( ).
Clicking the column header expands it, revealing details on the date of the last run and the number of successes and failures in last 24 hours. ).
Clicking the column header expands it, revealing details on the date of the last run and the number of successes and failures in last 24 hours.
|
| Enabled | Indicates whether the listener is enabled
( )
or disabled
( )
or disabled
( ).
Clicking the icon enables/disables the listener. ).
Clicking the icon enables/disables the listener.
|
| Actions |
By clicking the
 button, you can see details of the selected listener or delete it.
|
In case of listeners' events and tasks working with graphs, jobflows and profiler jobs, the
 button appears in their respective description fields. This buttong allows you to see the graph in the Sandboxes section of the Server Console GUI.
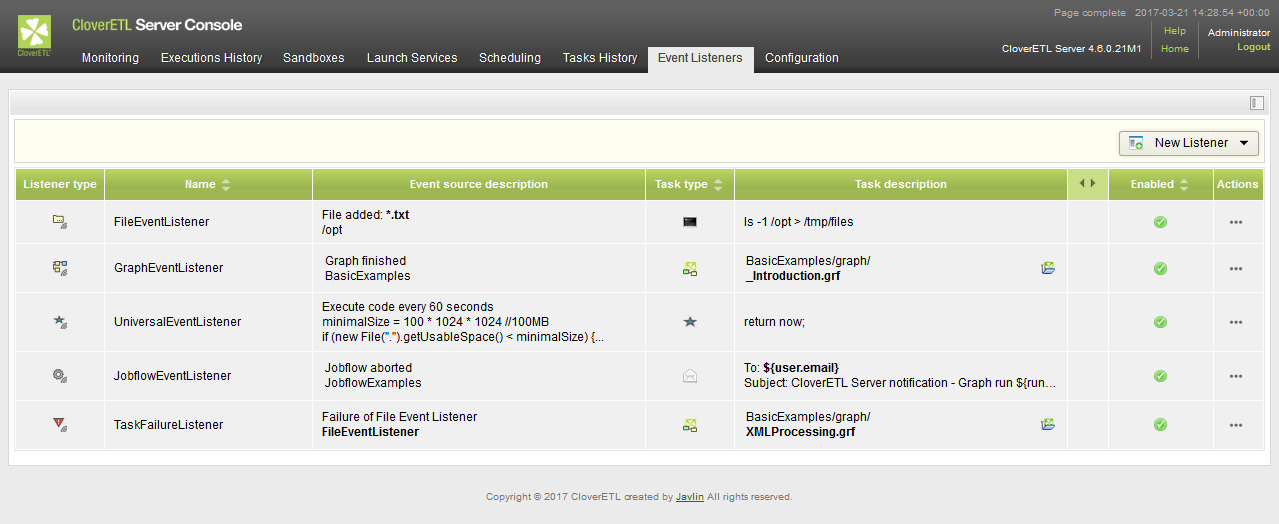
Figure 24.1. Listeners
The event is specific to the particular listener
 Graph Event Listeners
|
 Jobflow Event Listeners
 |
 JMS Messages Listeners
 |
 Universal Event Listeners
|
 File Event Listeners (remote and local)
|
 Task Failure Listeners
|
The available actions taken by the listeners are common for all listeners. The actions, that can be taken are:
 Send an e-mail - see Send an Email
 Execute a shell command - see Execute Shell Command
 Start a graph - see Start a Graph
 Start a jobflow - see Start a Jobflow
 Start a profiler job
 Abort a job - see Abort job
 Archivator - see Archive Records
 Send a JMS Message - see Send a JMS Message
 Execute a Groovy code - see Execute Groovy Code