Cluster Overview
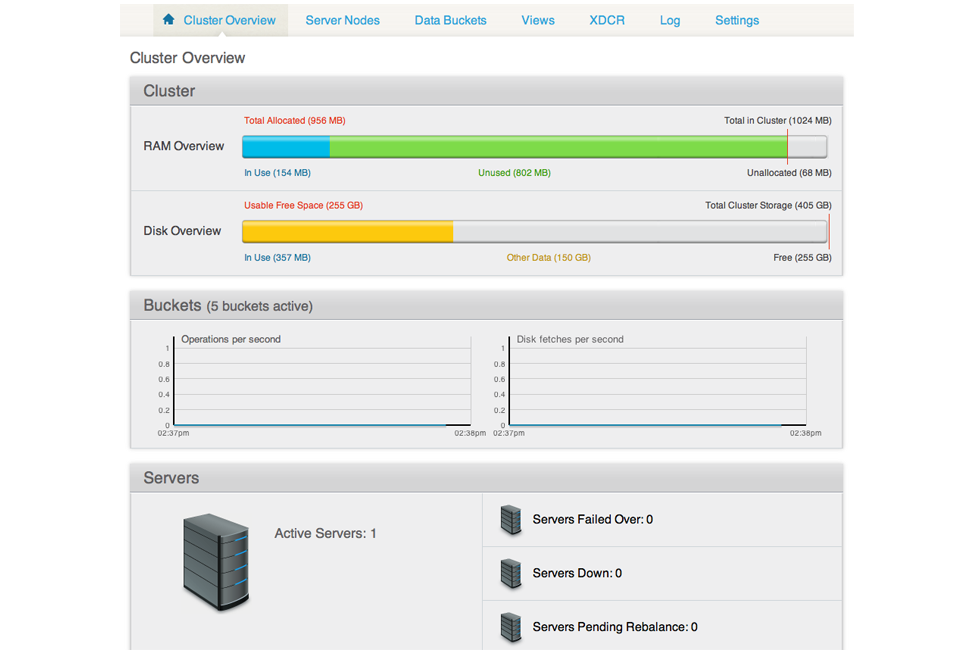
Cluster Overview is the home page and provides an overview of your cluster health, including RAM and disk usage and activity.
Viewing cluster overview
The Cluster section provides information on the RAM and disk usage information for your cluster.
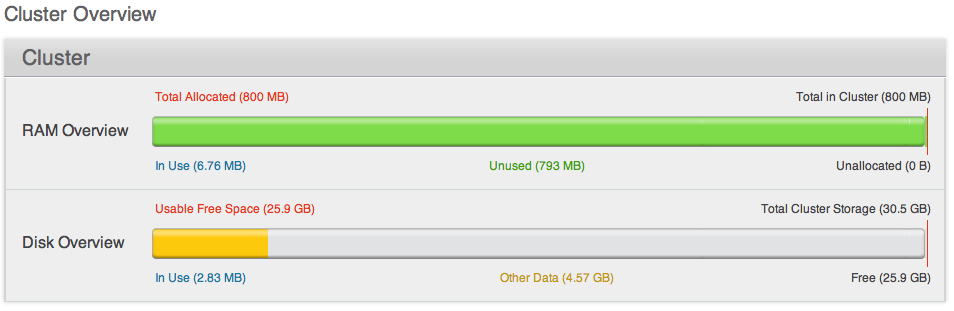
For the RAM information you are provided with a graphical representation of your RAM situation, including:
- Total in Cluster
Total RAM configured within the cluster. This is the total amount of memory configured for all the servers within the cluster.
- Total Allocated
The amount of RAM allocated to data buckets within your cluster.
- Unallocated
The amount of RAM not allocated to data buckets within your cluster.
- In Use
The amount of memory across all buckets that is actually in use (i.e. data is actively being stored).
- Unused
The amount of memory that is unused (available) for storing data.
The Disk Overview section provides similar summary information for disk storage space across your cluster.
- Total Cluster Storage
Total amount of disk storage available across your entire cluster for storing data.
- Usable Free Space
The amount of usable space for storing information on disk. This figure shows the amount of space available on the configured path after non-Couchbase files have been taken into account.
- Other Data
The quantity of disk space in use by data other than Couchbase information.
- In Use
The amount of disk space being used to actively store information on disk.
- Free
The free space available for storing objects on disk.
Viewing buckets
The Buckets section provides two graphs showing the Operations per second and Disk fetches per second.
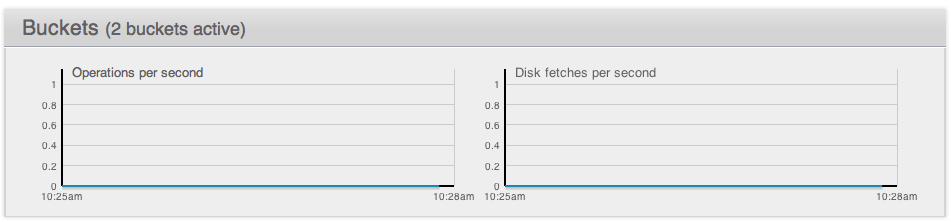
The Operations per second provides information on the level of activity on the cluster in terms of storing or retrieving objects from the data store.
The Disk fetches per second indicates how frequently Couchbase is having to go to disk to retrieve information instead of using the information stored in RAM.
Viewing servers
The Servers section indicates overall server information for the cluster:
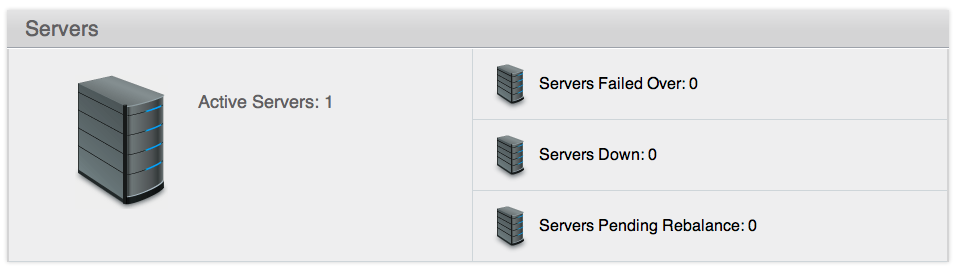
Active Servers is the number of active servers within the current cluster configuration.
Servers Failed Over is the number of servers that have failed over due to an issue that should be investigated.
Servers Down shows the number of servers that are down and not-contactable.
Servers Pending Rebalance shows the number of servers that are currently waiting to be rebalanced after joining a cluster or being reactivated after failover.