 | Documentation |
|---|---|
20.10. ReportingThe following 3 sections are present under Reporting:
20.10.1. StatisticsThe following reports are available under this category:
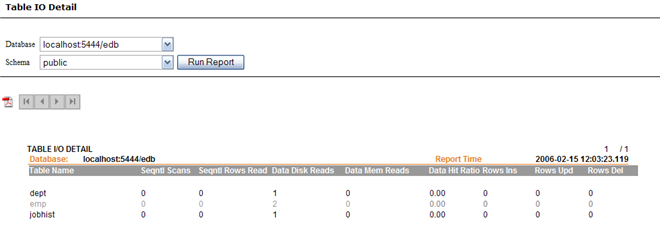
20.10.1.1. Table IO Detail ReportThis particular report lists the following information for all the tables under a monitored database:
Simply click on the Remember that in order to collect these statistics, the stats_start_collector and
stats_row_level parameters should be turned The Table IO Detail report can be very useful for database administrators for determining high activity tables, and then accordingly tuning them by adding indexes, or isolating them on a seperate disk.
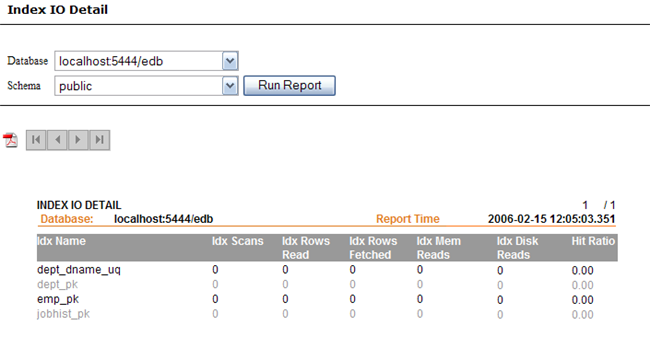
20.10.1.2. Index IO Detail ReportThis particular report lists the following information for each index under a monitored datasource:
Simply click on the Remember that in order to collect these statistics, the stats_start_collector and
stats_row_level parameters should be turned This report can be very useful for the DBA's to determine high or low activity indexes, and remove those indexes which are not being utilized and creating overhead.
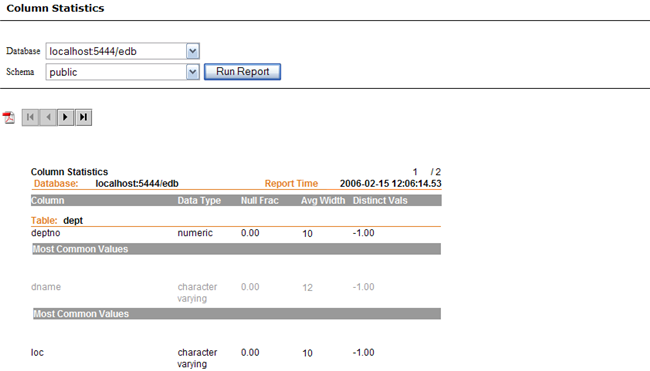
20.10.1.3. Column Statistics ReportThis report shows the statistics for the columns within a database table. The column names are grouped according to the table they belong to. The following information is displayed for every table column:
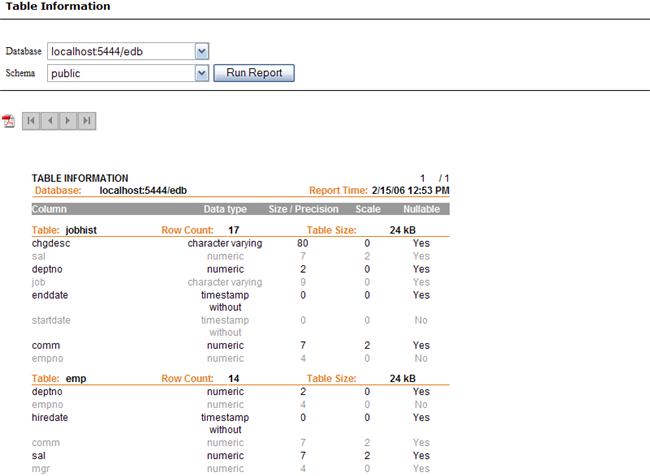
20.10.2. MetaDataThe MetaData related reports include the following: 20.10.2.1. Tables ReportThis report contains information about all the tables in a configured database. It provides us with the following information about every table column:
Additional table level information available with this report includes Row Count and Table Size.
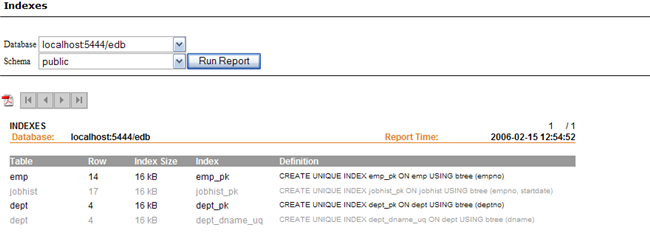
20.10.2.2. Indexes ReportThis report contains the following information about indexes on your database tables:
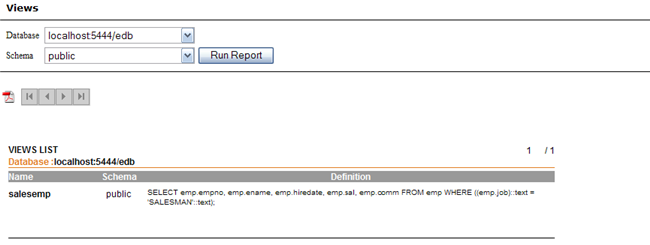
20.10.2.3. Views ReportThe Views report contains information about all the views present in a database. The page displays views in a list format along with their definitions.
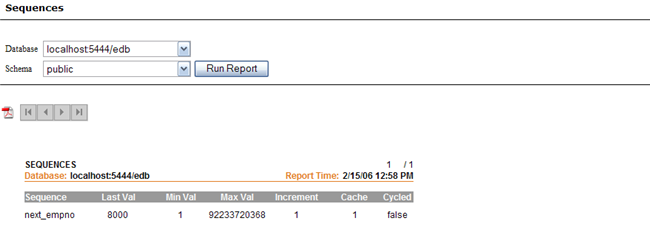
20.10.2.4. Sequences ReportThis report contains information about all the sequences within your monitored data source. Each row in this report contains the following information:
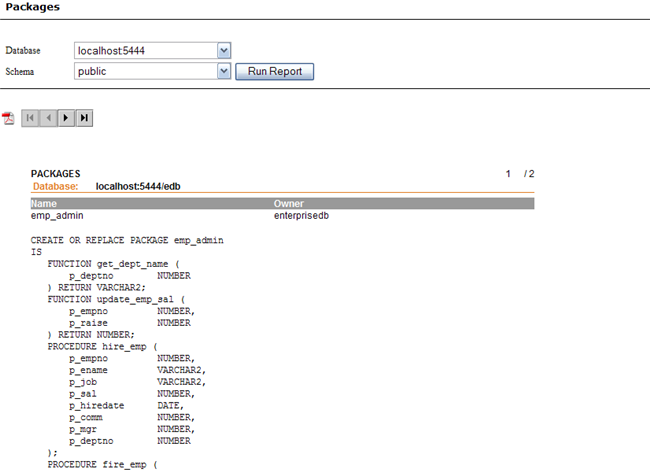
20.10.3. Procedural LogicThe Procedural Logic category of DBA Management Server, offers the following reports: 20.10.3.1. Packages ReportEnterpriseDB 8.1 and above has support for packages. The Packages report makes use of this new functionality to represent the complete package body and specification, along with the name and owner for all the packages in your database.
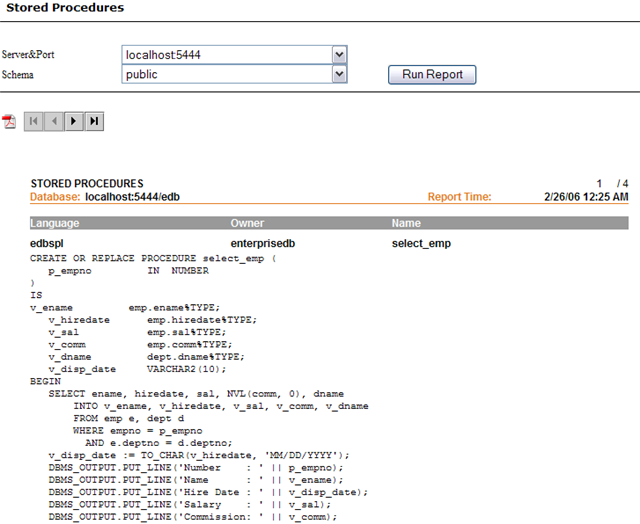
20.10.3.2. Procedures ReportEnterpriseDB also includes support for stored procedures. The purpose of this report is to list the complete procedure source code along with owner name and language for all the stored procedures in your database.
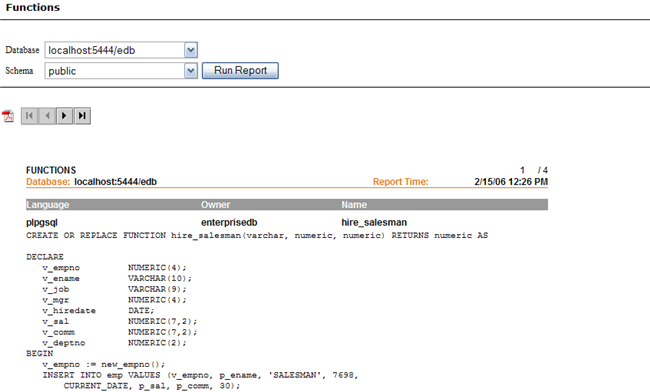
20.10.3.3. Functions ReportThis report provides the end user with information about all the database functions present in their database.
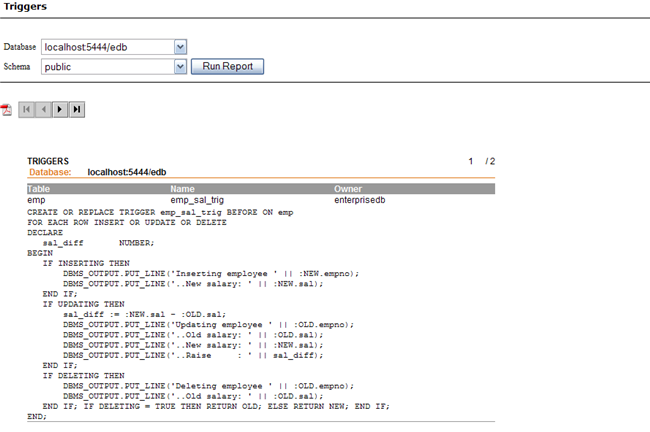
20.10.3.4. Triggers ReportThis report is similar to other reports in this category. All trigger relevent information including the trigger's name, the table name the trigger is on, the owner of the trigger as well as the source code of the trigger is shown in this report.
|

