Public Member Functions | |
| __construct ($params) | |
| calltreeCount ($stack, $start) | |
| Counts the number of profiled function calls sitting under the given point in the call graph. | |
| close () | |
| Close opened profiling sections. | |
| debug ($s) | |
| Add an entry in the debug log file. | |
| getCallTree () | |
| Returns a tree of function call instead of a list of functions. | |
| getCallTreeLine ($entry) | |
| Callback to get a formatted line for the call tree. | |
| getCurrentSection () | |
| Get the function name of the current profiling section. | |
| getFunctionReport () | |
| Returns a list of profiled functions. | |
| getOutput () | |
| Returns a profiling output to be stored in debug file. | |
| getProfileID () | |
| getTime ($metric=false) | |
| Get the initial time of the request, based either on $wgRequestTime or $wgRUstart. | |
| isPersistent () | |
| Return whether this profiler stores data. | |
| isStub () | |
| Return whether this a stub profiler. | |
| logData () | |
| Log the whole profiling data into the database. | |
| profileIn ($functionname) | |
| Called by wfProfieIn() | |
| profileOut ($functionname) | |
| Called by wfProfieOut() | |
| remapCallTree ($stack) | |
| Recursive function the format the current profiling array into a tree. | |
| setProfileID ($id) | |
| setTemplated ($t) | |
| Mark this call as templated or not. | |
Static Public Member Functions | |
| static | instance () |
| Singleton. | |
| static | setInstance (Profiler $p) |
| Set the profiler to a specific profiler instance. | |
Public Attributes | |
| $mCalls = array () | |
| $mCollated = array () | |
| $mCollateDone = false | |
| $mTemplated = false | |
| $mTotals = array () | |
| $mWorkStack = array () | |
Protected Member Functions | |
| addInitialStack () | |
| Add the inital item in the stack. | |
| collateData () | |
| getInitialTime ($metric=false) | |
| Get the initial time of the request, based either on $wgRequestTime or $wgRUstart. | |
Static Protected Member Functions | |
| static | calculateOverhead ($profileCount) |
| Dummy calls to wfProfileIn/wfProfileOut to calculate its overhead. | |
Protected Attributes | |
| $mProfileID = false | |
| $mStack = array() | |
| $mTimeMetric = 'wall' | |
Static Private Attributes | |
| static | $__instance = null |
Detailed Description
- Todo:
- document
Definition at line 55 of file Profiler.php.
Constructor & Destructor Documentation
| Profiler::__construct | ( | $ | params | ) |
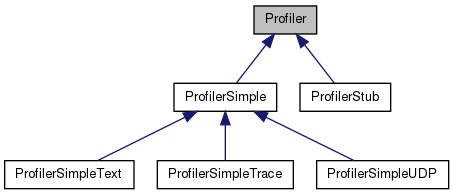
Reimplemented in ProfilerSimpleText.
Definition at line 62 of file Profiler.php.
References $params, and addInitialStack().
Member Function Documentation
| Profiler::addInitialStack | ( | ) | [protected] |
Add the inital item in the stack.
Reimplemented in ProfilerSimple.
Definition at line 142 of file Profiler.php.
References getInitialTime(), getTime(), and profileIn().
Referenced by __construct().
| static Profiler::calculateOverhead | ( | $ | profileCount | ) | [static, protected] |
Dummy calls to wfProfileIn/wfProfileOut to calculate its overhead.
Definition at line 484 of file Profiler.php.
References wfProfileIn(), and wfProfileOut().
Referenced by collateData().
| Profiler::calltreeCount | ( | $ | stack, |
| $ | start | ||
| ) |
Counts the number of profiled function calls sitting under the given point in the call graph.
Not the most efficient algo.
- Parameters:
-
$stack Array: $start Integer:
- Returns:
- Integer
- Access:
- private
Definition at line 502 of file Profiler.php.
References $count.
Referenced by collateData().
| Profiler::close | ( | ) |
Close opened profiling sections.
Reimplemented in ProfilerStub.
Definition at line 207 of file Profiler.php.
References profileOut().
Referenced by collateData(), ProfilerSimpleUDP\logData(), and ProfilerSimpleText\logData().
| Profiler::collateData | ( | ) | [protected] |
Definition at line 376 of file Profiler.php.
References $fname, calculateOverhead(), calltreeCount(), and close().
Referenced by getFunctionReport(), and logData().
| Profiler::debug | ( | $ | s | ) |
Add an entry in the debug log file.
- Parameters:
-
$s String to output
Definition at line 589 of file Profiler.php.
Referenced by ProfilerSimple\profileIn(), profileIn(), ProfilerSimpleTrace\profileOut(), ProfilerSimple\profileOut(), and profileOut().
Returns a tree of function call instead of a list of functions.
- Returns:
- string
Definition at line 246 of file Profiler.php.
References remapCallTree().
Referenced by getOutput().
| Profiler::getCallTreeLine | ( | $ | entry | ) |
Callback to get a formatted line for the call tree.
- Returns:
- string
Definition at line 295 of file Profiler.php.
References $fname.
Get the function name of the current profiling section.
- Returns:
Reimplemented in ProfilerStub.
Definition at line 579 of file Profiler.php.
Returns a list of profiled functions.
- Returns:
- string
Reimplemented in ProfilerSimple.
Definition at line 458 of file Profiler.php.
References $fname, $total, and collateData().
Referenced by getOutput().
| Profiler::getInitialTime | ( | $ | metric = false | ) | [protected] |
Get the initial time of the request, based either on $wgRequestTime or $wgRUstart.
Will return null if not able to find data.
- Parameters:
-
$metric string|false: metric to use, with the following possibilities: - user: User CPU time (without system calls)
- cpu: Total CPU time (user and system calls)
- wall (or any other string): elapsed time
- false (default): will fall back to default metric
- Returns:
- float|null
Definition at line 348 of file Profiler.php.
References $wgRequestTime.
Referenced by ProfilerSimple\addInitialStack(), addInitialStack(), and ProfilerSimple\getCpuTime().
Returns a profiling output to be stored in debug file.
- Returns:
- String
Reimplemented in ProfilerStub.
Definition at line 227 of file Profiler.php.
References getCallTree(), and getFunctionReport().
Definition at line 131 of file Profiler.php.
References wfWikiID().
Referenced by ProfilerSimpleUDP\logData().
| Profiler::getTime | ( | $ | metric = false | ) |
Get the initial time of the request, based either on $wgRequestTime or $wgRUstart.
Will return null if not able to find data.
- Parameters:
-
$metric string|false: metric to use, with the following possibilities: - user: User CPU time (without system calls)
- cpu: Total CPU time (user and system calls)
- wall (or any other string): elapsed time
- false (default): will fall back to default metric
- Returns:
- float|null
Definition at line 315 of file Profiler.php.
Referenced by addInitialStack(), ProfilerSimple\getCpuTime(), ProfilerSimple\profileIn(), profileIn(), ProfilerSimpleTrace\profileOut(), ProfilerSimple\profileOut(), and profileOut().
| static Profiler::instance | ( | ) | [static] |
Singleton.
- Returns:
- Profiler
Definition at line 77 of file Profiler.php.
References $__instance, $wgProfiler, and wfDebug().
Referenced by ApiBase\dieUsage(), TestFileOpPerformance\execute(), SkinTemplate\outputPage(), wfLogProfilingData(), wfProfileIn(), and wfProfileOut().
Return whether this profiler stores data.
- See also:
- Profiler::logData()
- Returns:
- Boolean
Reimplemented in ProfilerSimple, ProfilerStub, and ProfilerSimpleUDP.
Definition at line 123 of file Profiler.php.
| Profiler::isStub | ( | ) |
Return whether this a stub profiler.
- Returns:
- Boolean
Reimplemented in ProfilerStub.
Definition at line 113 of file Profiler.php.
Log the whole profiling data into the database.
Reimplemented in ProfilerSimple, ProfilerSimpleTrace, ProfilerSimpleText, ProfilerStub, and ProfilerSimpleUDP.
Definition at line 514 of file Profiler.php.
References collateData(), wfGetDB(), wfHostname(), and wfReadOnly().
| Profiler::profileIn | ( | $ | functionname | ) |
Called by wfProfieIn()
- Parameters:
-
$functionname String
Reimplemented in ProfilerSimple, ProfilerStub, and ProfilerSimpleTrace.
Definition at line 158 of file Profiler.php.
References debug(), and getTime().
Referenced by addInitialStack().
| Profiler::profileOut | ( | $ | functionname | ) |
Called by wfProfieOut()
- Parameters:
-
$functionname String
Reimplemented in ProfilerSimple, ProfilerSimpleTrace, and ProfilerStub.
Definition at line 172 of file Profiler.php.
References debug(), and getTime().
Referenced by close().
| Profiler::remapCallTree | ( | $ | stack | ) |
Recursive function the format the current profiling array into a tree.
- Parameters:
-
$stack array profiling array
- Returns:
- array
Definition at line 256 of file Profiler.php.
References $output.
Referenced by getCallTree().
| static Profiler::setInstance | ( | Profiler $ | p | ) | [static] |
Set the profiler to a specific profiler instance.
Mostly for dumpHTML
- Parameters:
-
$p Profiler object
Definition at line 104 of file Profiler.php.
| Profiler::setProfileID | ( | $ | id | ) |
Definition at line 127 of file Profiler.php.
| Profiler::setTemplated | ( | $ | t | ) |
Mark this call as templated or not.
- Parameters:
-
$t Boolean
Definition at line 218 of file Profiler.php.
References $t.
Member Data Documentation
Profiler::$__instance = null [static, private] |
Definition at line 60 of file Profiler.php.
Referenced by instance().
| Profiler::$mCalls = array () |
Definition at line 57 of file Profiler.php.
| Profiler::$mCollated = array () |
Definition at line 56 of file Profiler.php.
| Profiler::$mCollateDone = false |
Definition at line 59 of file Profiler.php.
Profiler::$mProfileID = false [protected] |
Definition at line 59 of file Profiler.php.
Profiler::$mStack = array() [protected] |
Definition at line 56 of file Profiler.php.
| Profiler::$mTemplated = false |
Definition at line 59 of file Profiler.php.
Profiler::$mTimeMetric = 'wall' [protected] |
Definition at line 58 of file Profiler.php.
| Profiler::$mTotals = array () |
Definition at line 57 of file Profiler.php.
| Profiler::$mWorkStack = array () |
Definition at line 56 of file Profiler.php.
The documentation for this class was generated from the following file:
- includes/profiler/Profiler.php