Table of Contents
On Windows Msc-generator is installing as a regular application. You can start it directly, by clicking on a file with .signalling extension or by opening an embedded chart.
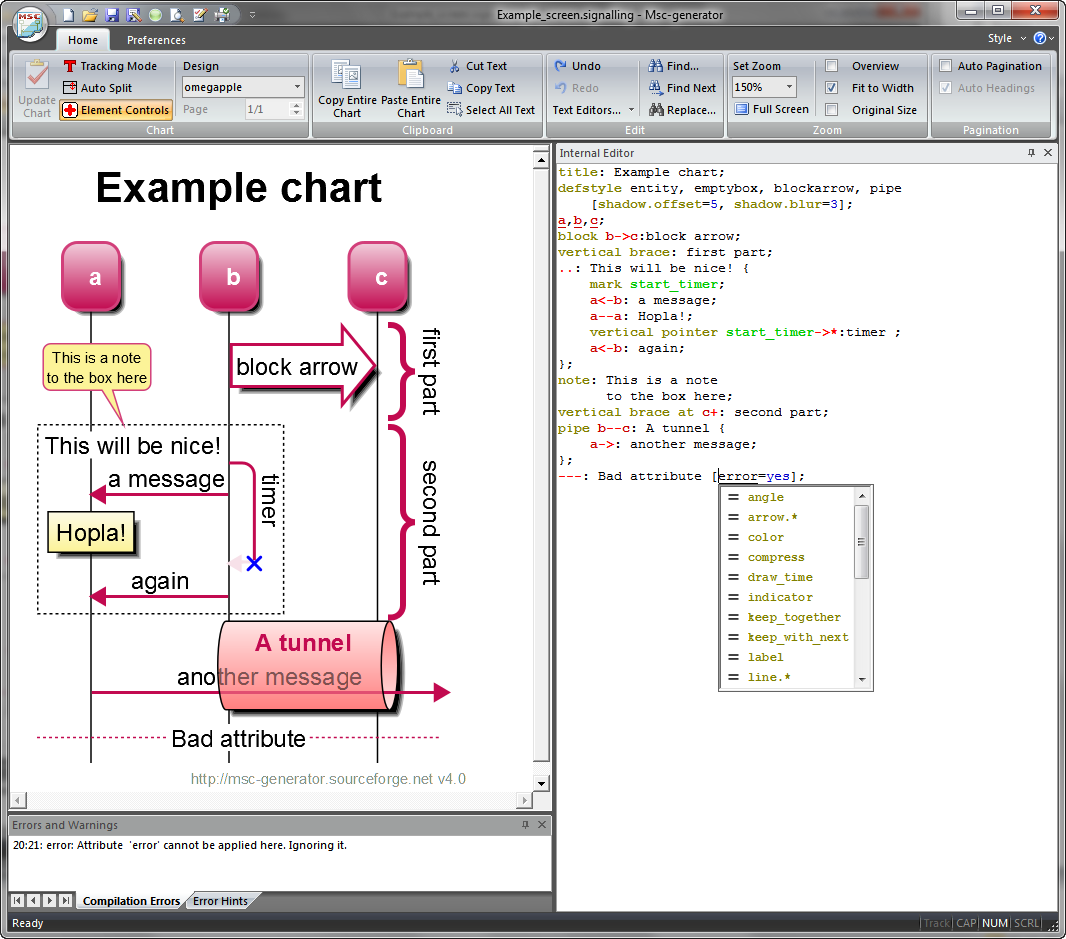
The Msc-generator window has the usual elements of a Windows application: menu bar, a ribbon and a status bar. We will briefy discuss these here and give a more detailed description in Usage Reference.
You can use the scrollbars to navigate around in the chart. You can also grab the chart by the mouse and drag it (if not all of it fits into the window).
You can also reposition the pane of the internal editor and the error list by clicking on their title bar and dragging them to a new location. On the example above, the internal editor has been moved to the right side from the left (which is the default). You can even create floating windows out of these panes.
If you accidentally close the internal editor, use the ‘Text Editors...’
button on the ribbon and re-select ‘Internal Editor’.
Msc-generator has a built-in text editor, with color syntax highlighting. You can
freely edit the chart description there. When you are ready, press
the ‘Update Chart’ button on the ribbon (or Ctrl+W or F2 on the keyboard)
and the visual view of the chart will get updated. Any error or warning messages
will show up in a panel at the bottom.
You can use the Main button on the ribbon or the quick access items in the window
title to load/save the file. The file format is simply
text, the very same that you edit inside Msc-generator’s text editor.
You can also save the file
in various graphics formats using the Main|Export... item.
Pressing the Main button you also find the usual Print and Print Preview commands.
The Clipboard pane on the ribbon has two set of Copy/Paste operations: one for text in the text editor and a separate set for the entire chart. If you use paste for the entire chart, then its whole content is replaced, whereas if you paste into the editor, the content of the clipboard will be inserted.
You can also perform undo or redo from the Edit pane of the ribbon or by pressing Ctrl+Z or Ctrl+Y. Similar search and replace operations for the text editor can also be accessed from the Edit pane.
Finally, there is a separate button in the Edit pane to start and stop the internal or an external text editor (see External Editor). The latter is useful in case you prefer to use your own editor.