Table of Contents
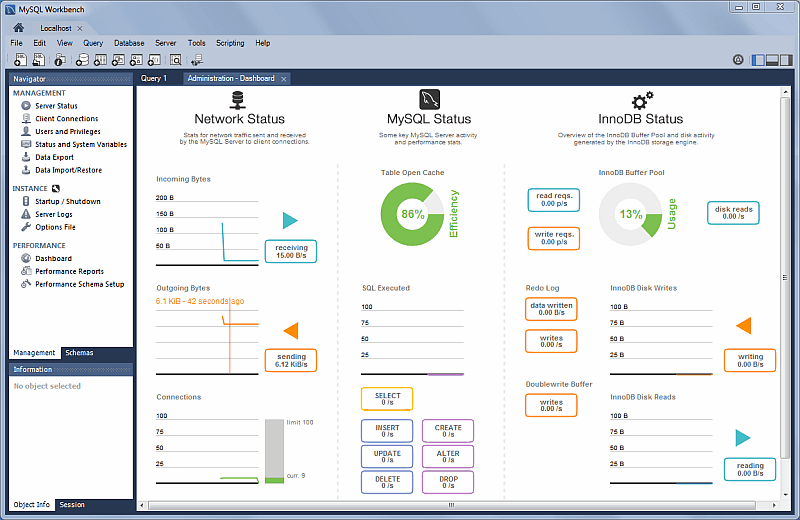
View server performance statistics in a graphical dashboard.
This highlights statistics for network traffic sent and received by the MySQL server over client connections. Data points include the Incoming Network Traffic, Outgoing Network Traffic, and Client Connections.
This highlights the primary MySQL server activity and performance statistics. Data points include the Table Open Cache efficiency, SQL Statements Executed, and counts (per second) for SELECT, INSERT, UPDATE, DELETE, CREATE, ALTER, and DROP statements.
This provides an overview of the InnoDB Buffer Pool and disk activity that is generated by the InnoDB storage engine. Data points are separated into three groups:
Hover over a graph to see additional information, such as a total count.
Usage
Read Requests: The number of logical read requests (per second) InnoDB has performed to the buffer pool.
Write Requests: The number of logical write requests (per second) InnoDB has performed to the buffer pool.
Disk Reads: The number of logical reads that InnoDB could not satisfy from the buffer pool. As a result, these had to be read from the disk.
InnoDB Buffer Pool Usage: The percentage of the InnoDB buffer pool that is in use. Hover over the graphic to see additional information, such as Usage Rate and Pages Free.
Writes
Data Written: The number of writes written to the InnoDB redo log file.
Writes: The number of physical writes written to the InnoDB redo log file.
InnoDB Disk Writes: Hover over this dynamic graph to see the number of disk writes over a specific second. The available range includes the last 120 seconds.
Writing: Total amount of data (in bytes) written using file operations by the InnoDB storage engine.
Reads
Doublewrite Buffer Writes: The number of doublewrite operations that were performed.
InnoDB Disk Reads: Hover over this dynamic graph to see the number of disk reads over a specific second. The available range includes the last 120 seconds.
Reading: Total amount of data (in bytes) read in file operations by the InnoDB storage engine.
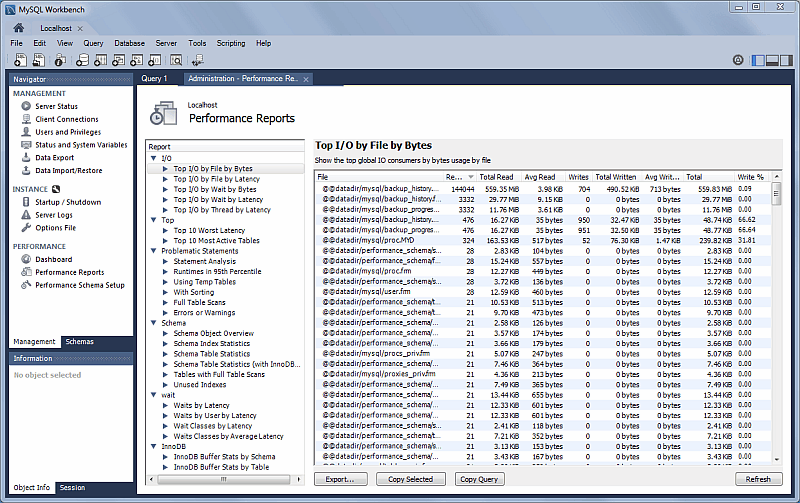
Performance schema based reports provide insight into the MySQL server operations through helpful high-level reports. MySQL Workbench uses the SYS views on the Performance Schema to generate over 20 reports to help analyze the performance of your MySQL databases. Reports help analyze IO hotspots, discover high cost SQL statements, and review wait statistics and InnoDB engine metrics.
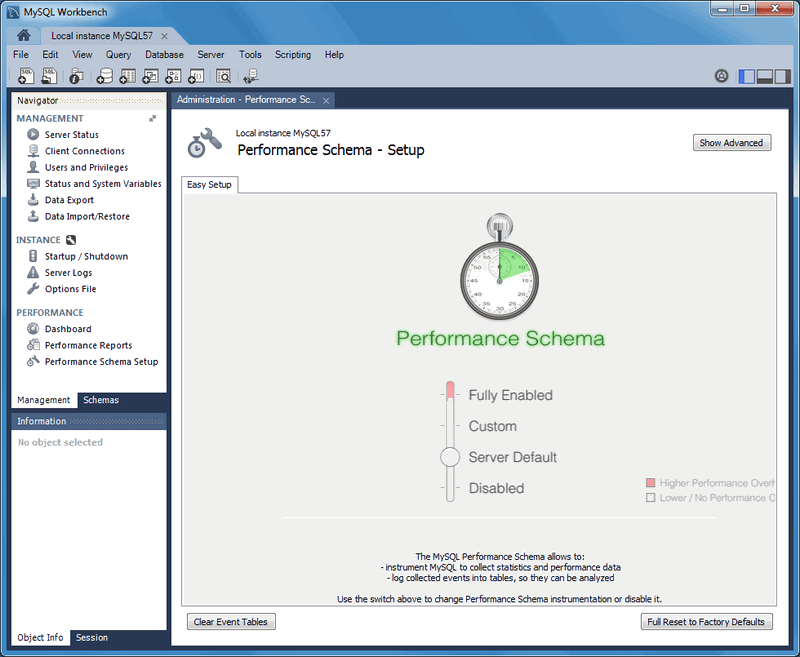
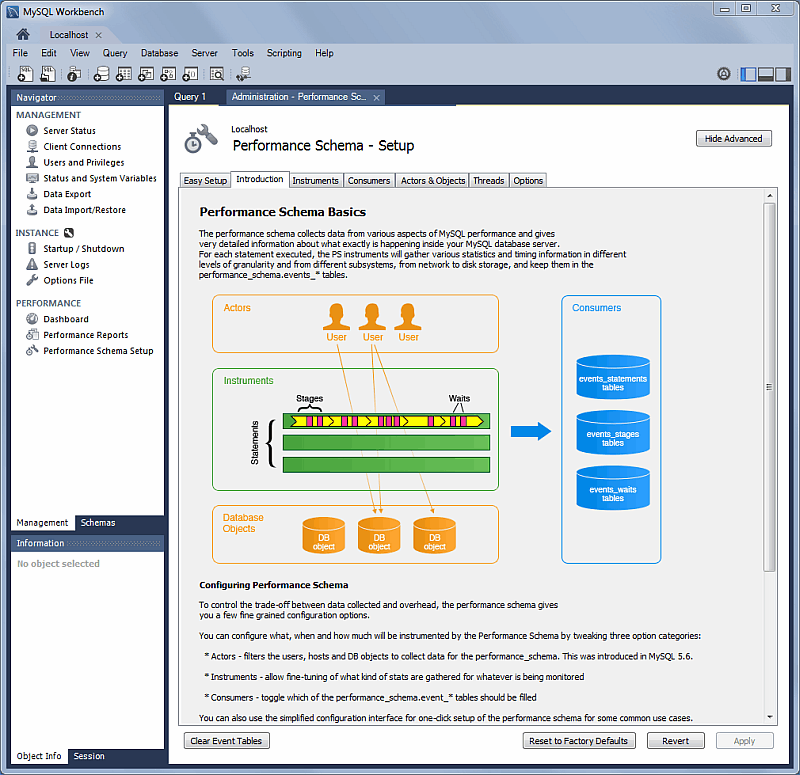
A GUI for configuring and fine tuning the Performance Schema instrumentation. Initially, this loads an "Easy Setup" page that is enough for most users. Slide the "Performance Schema Full Enabled" slider to YES to enable all available Performance Schema instruments.
The size of the saved digested query is determined by the MySQL server.
Clicking provides methods to fine tune the Performance Schema instrumentation.
The available performance reports include (this is a non-exhaustive list):
Top File I/O Activity Report: Show the files performing the most IOs (in bytes)
Top I/O by File by Time: Show the highest IO usage by file and latency
Top I/O by Event Category: Show the highest IO Data usage by event categories
Top I/O in Time by Event Categories: Show the highest IO time consumers by event categories
Top I/O Time by User/Thread: Show the top IO time consumers by user/thread
Statement Analysis: Lists statements with aggregated statistics
Statements in Highest 5 Percent by Runtime: Lists the top 5% statements with the highest runtime (in microseconds),
Using Temp Tables: Lists all statements that use temporary tables -- accesses the highest number of disk temporary tables, then memory temp tables
With Sorting: List all normalized statements that have done sorts, and accesses them in the following priority order -- sort_merge_passes, sort_scans, then sort_rows
Full Table Scans: Lists statements that performed a full table scan. Accesses query performance and the where clause(s), and if no index is used then it recommends adding indexes for large tables
Errors or Warnings: Lists statements that have raised errors or warnings
Schema Object Overview (High Overhead): Shows counts by object type for each schema
NoteThis can take a long time to execute on instances with a large number of objects.
Schema Index Statistics
Schema Table Statistics
Schema Table Statistics (with InnoDB buffer)
Tables with Full Table Scans: Finds tables that are being accessed by full table scans, ordering them by the number of rows scanned (DESC)
Unused Indexes: List of indexes that were never used since the server started or since P_S data collection started
Waits by Time: Lists the top wait events by their total time, ignoring idle (this often contain large values)
Waits by User by Time: Lists the top wait events by their total time, ignoring idle (this often contain large values)
Wait Classes by Time: Lists the top wait classes by total time, ignoring idle (this often contain large values)
Waits Classes by Average Time: Lists the top wait classes by average time, ignoring idle (this often contain large values)
InnoDB Buffer Stats by Schema: Summarizes the output of the
INFORMATION_SCHEMA.INNODB_BUFFER_PAGEtable, aggregating it by schemaInnoDB Buffer Stats by Table: Summarizes the output of the
INFORMATION_SCHEMA.INNODB_BUFFER_PAGEtable, aggregating it by schema and table name
The Visual Explain feature generates and
displays a visual representation of the MySQL
EXPLAIN statement by using extended information
available in the extended JSON format.
The extended EXPLAIN format is available as of MySQL server 5.6.5.
MySQL Workbench provides all of the EXPLAIN formats for executed queries including the raw extended JSON, traditional format, and visual query plan.
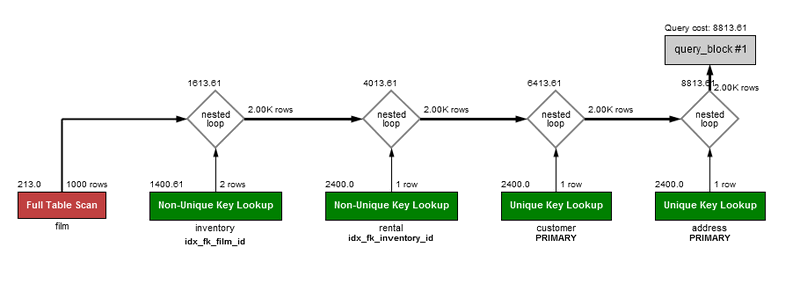
An example Visual Explain diagram:
SELECT CONCAT(customer.last_name, ', ', customer.first_name) AS customer, address.phone, film.title
FROM rental
INNER JOIN customer ON rental.customer_id = customer.customer_id
INNER JOIN address ON customer.address_id = address.address_id
INNER JOIN inventory ON rental.inventory_id = inventory.inventory_id
INNER JOIN film ON inventory.film_id = film.film_id
WHERE rental.return_date IS NULL
AND rental_date + INTERVAL film.rental_duration DAY < CURRENT_DATE()
LIMIT 5;
The order of execution is bottom to top, and left to right.
Graphic Conventions
Standard Boxes: tables
Rounded boxes: operations such as GROUP and SORT
Framed boxes: subqueries
Diamonds: joins
Textual Conventions
Standard text below boxes: table (or alias) name
Bold text below boxes: key/index that was used
Number in top right of a box: number of rows used from the table after filtering
Number in top left of a box: relative cost of accessing that table (requires MySQL 5.7 or greater)
Number to the right of nested loop diamonds: number of rows produced by the JOIN
Number above the loop diamonds: relative cost of the JOIN (requires MySQL 5.7 or greater)
The associated colors and descriptions used in the Visual Explain diagram:
Table 7.1 Visual Explain Diagram Information
| System Name | Color | Text on Visual Diagram | Tooltip related information |
|---|---|---|---|
| SYSTEM | Blue | Single row: system constant | Very low cost |
| CONST | Blue | Single row: constant | Very low cost |
| EQ_REF | Green | Unique Key Lookup | Low cost -- The optimizer is able to find an index that it can use to retrieve the required records. It is fast because the index search directly leads to the page with all the row data |
| REF | Green | Non-Unique Key Lookup | Low-medium -- Low if the number of matching rows is small; higher as the number of rows increases |
| FULLTEXT | Yellow | Fulltext Index Search | Specialized FULLTEXT search. Low -- for this specialized search requirement |
| REF_OR_NULL | Green | Key Lookup + Fetch NULL Values | Low-medium -- if the number of matching rows is small; higher as the number of rows increases |
| INDEX_MERGE | Green | Index Merge | Medium -- look for a better index selection in the query to improve performance |
| UNIQUE_SUBQUERY | Orange | Unique Key Lookup into table of subquery | Low -- Used for efficient Subquery processing |
| INDEX_SUBQUERY | Orange | Non-Unique Key Lookup into table of subquery | Low -- Used for efficient Subquery processing |
| RANGE | Orange | Index Range Scan | Medium -- partial index scan |
| INDEX | Red | Full Index Scan | High -- especially for large indexes |
| ALL | Red | Full Table Scan | Very High -- very costly for large tables, but less of an impact for small ones. No usable indexes were found for the table, which forces the optimizer to search every row. This could also mean that the search range is so broad that the index would be useless. |
| UNKNOWN | Black | unknown | Note: This is the default, in case a match cannot be determined |
To view a visual explain execution plan, execute your query from the SQL editor and then choose the Execution Plan tab in the query results tab. The execution plan defaults to "Visual Explain" but also has a "Tabular Explain" view that is similar to what you would see when executing EXPLAIN in the MySQL client.
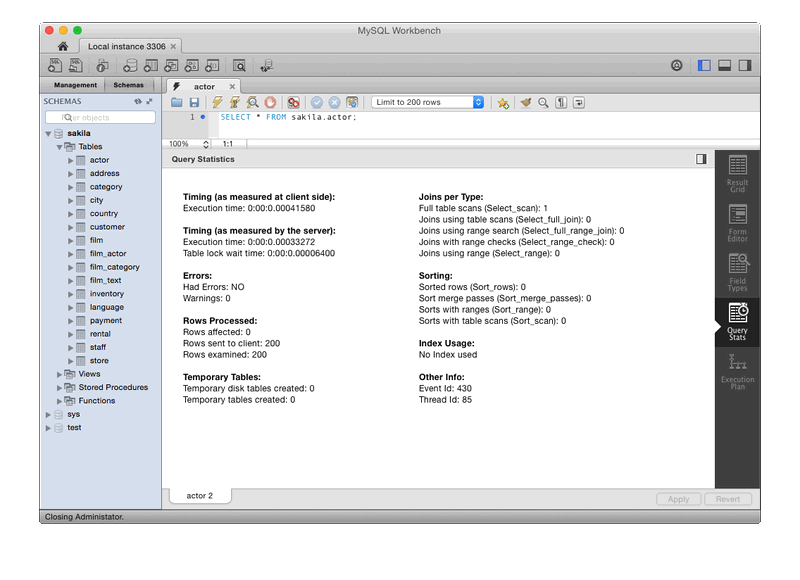
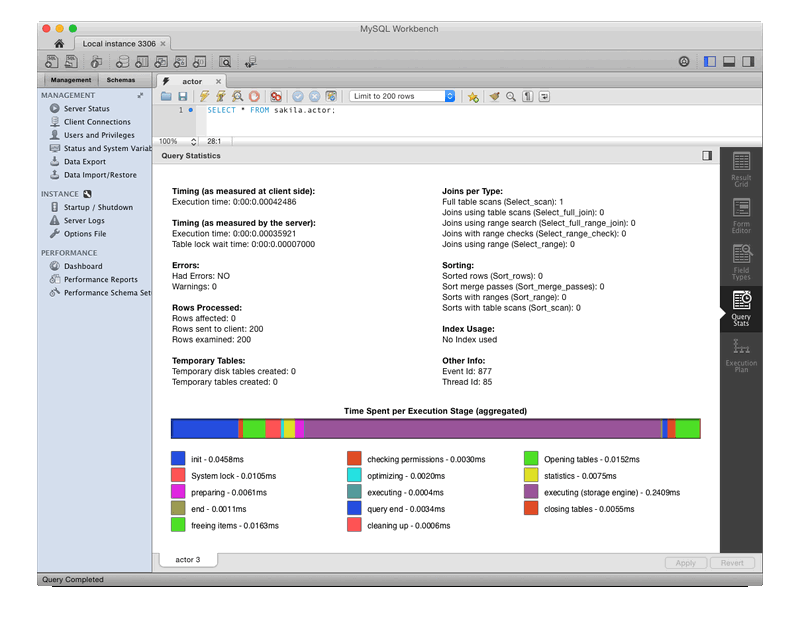
This Query Stats SQL editor results tab uses Performance Schema data to gather key statistics collected for executed query, such as timing, temporary tables, indexes, joins, and more.
Requirements
MySQL server 5.6 or newer
, enabled.
The
performance_schemaenabled with statement instrumentation
In this example, Visual Explain helps locate and fix problematic (slow) queries. This tutorial uses the DBT-3 database, and begins with the following query:
  SELECT * FROM orders
  WHERE YEAR(o_orderdate) = 1992 AND MONTH(o_orderdate) = 4
  AND o_clerk LIKE '%0223';
In the screenshot below, we executed this query and generated a Visual Explain report by selecting , from the main menu.
Notice that ...
Why did this query generate a full table scan? Why is our indexed
o_orderdate column missing as a possible key?
Looking more closely, we notice that our indexed column is being
used in an expression as "WHERE YEAR(o_orderdate) = 1992
AND MONTH(o_orderdate) = 4", so its index is not used. To
use the existing index we can adjust the query like so:
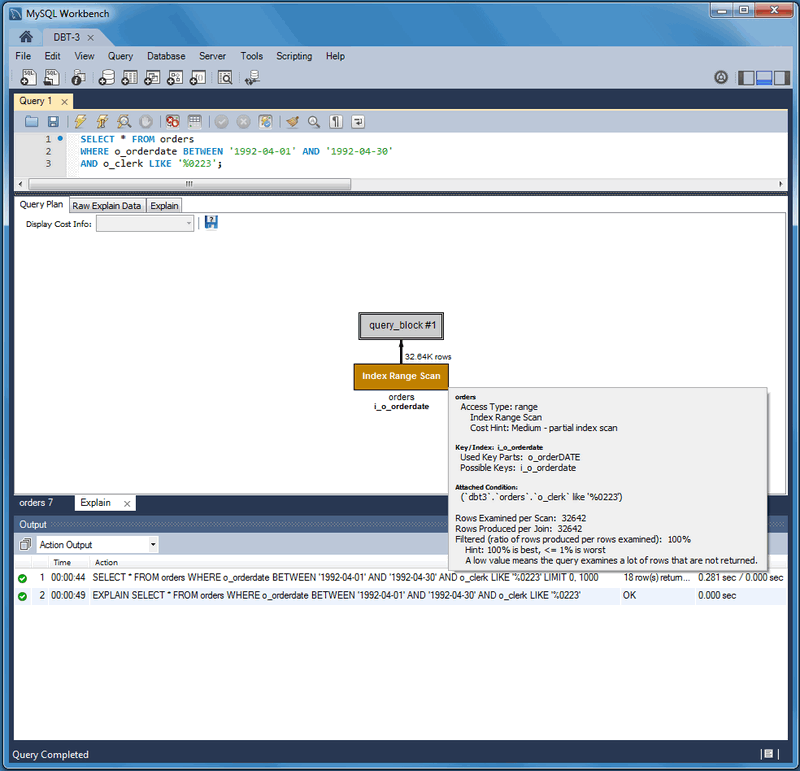
  SELECT * FROM orders
  WHERE o_orderdate BETWEEN '1992-04-01' AND '1992-04-30'
  AND o_clerk LIKE '%0223';
Notice the differences. The Type changed from ALL to range, possible
keys (and used key) changed from NULL to i_o_orderdate, and the
number of scanned rows changed from 1.5 million to about 33
thousand. Still, scanning 33 thousand rows while returning just 18
is unnecessary, so we focus on the o_clerk
column. An index here should improve performance: so:
CREATE INDEX i_o_clerk ON orders(o_clerk);
Notice that our new index is not being considered as a possible key.
This is because we are searching the suffix of the
o_clerk column, and indexes do not work with
suffixes (although they do work with prefixes). In our simple case,
we were being lazy and could have simply used the entire clerk ID.
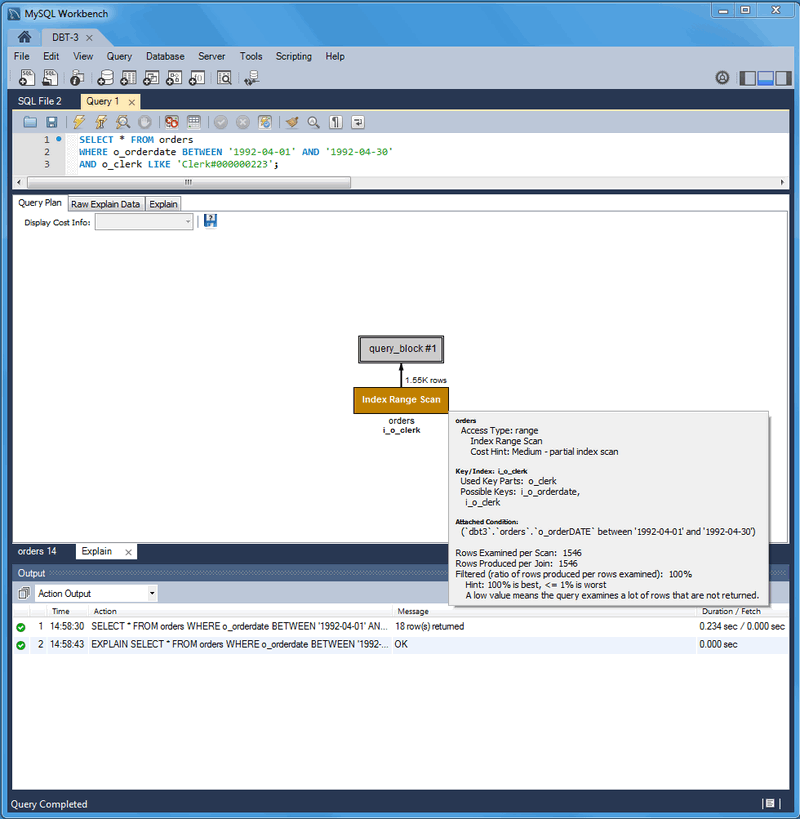
Adjusting the query shows better results:
SELECT * FROM orders
WHERE o_orderdate BETWEEN '1992-04-01' AND '1992-04-30'
AND o_clerk LIKE 'Clerk#000000223';
The new o_clerk index was considered and used,
and our query scanned 1546 rows instead of 32642, and the query
execution improved from 0.281 to 0.234 seconds. However, EXPLAIN
estimates that this query scans 1546 rows to return 18. After
reviewing our query, notice that a multi-column index can meet the
conditions of our WHERE clause that is based on both the
o_orderdate and o_clerk
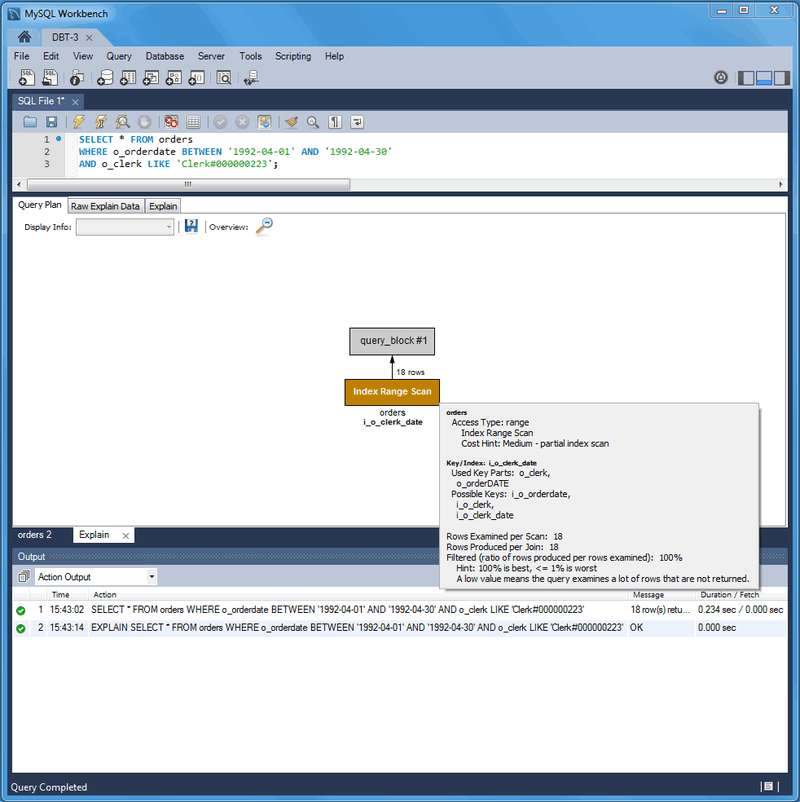
columns:
CREATE INDEX io_clerk_date ON orders(o_clerk, o_orderdate)
We listed o_clerk as the first column in our
index because o_orderdate uses a range. ...
Now, executing the same query shows even better results. An estimated 18 rows are both scanned and returned, and the execution time of our query is 0.234 seconds.
To summarize the results:
Table 7.2 DBT-3 Visual Explain Tutorial Query Comparison
| Type | Possible keys | Key | Rows Scanned | Duration (seconds) | Extra info | Rows returned |
|---|---|---|---|---|---|---|
| all | NULL | NULL | 1.50M | 1.201 | Using where | 18 |
| range | i_o_orderdate | i_o_orderdate | 32642 | 0.281 | Using index condition; Using where | 18 |
| range | i_o_orderdate, i_o_clerk | i_o_clerk | 1546 | 0.234 | Using index condition; Using where | 18 |
| range | i_o_orderdate, i_o_clerk, i_o_clerk_date | i_o_clerk_date | 18 | 0.234 | Using index condition | 18 |
