Remote Debugging
Qt Creator makes remote debugging easy. In general, the remote debugging setup consist of a probe running on the remote machine and a counterpart running on the host side. The probe is either integrated into the running process (e.g. for QML debugging) or runs a separate process (e.g. when using GDB server on embedded Linux). The host side typically consists of Qt Creator itself, often with the help of an external process, such as GDB or CDB.
While this setup might look daunting, it is mostly invisible to the user of Qt Creator. To start debugging on a remote target with the necessary helper processes running, select the corresponding kit in Projects > Build & Run, and then select a function to start remote debugging in the Debug > Start Debugging menu.
Special use cases, such as attaching to a running process on the target, might still require manual setup.
Using GDB
When debugging on a target supported by GDB server, a local GDB process talks to a GDB server running on the remote machine that controls the process to be debugged.
The GDB server process is started on the remote machines by passing a port number and the executable:
gdbserver :1234 <executable>
It then typically responds:
Process bin/qtcreator created; pid = 5159
Listening on port 1234
On the local machine that runs Qt Creator:
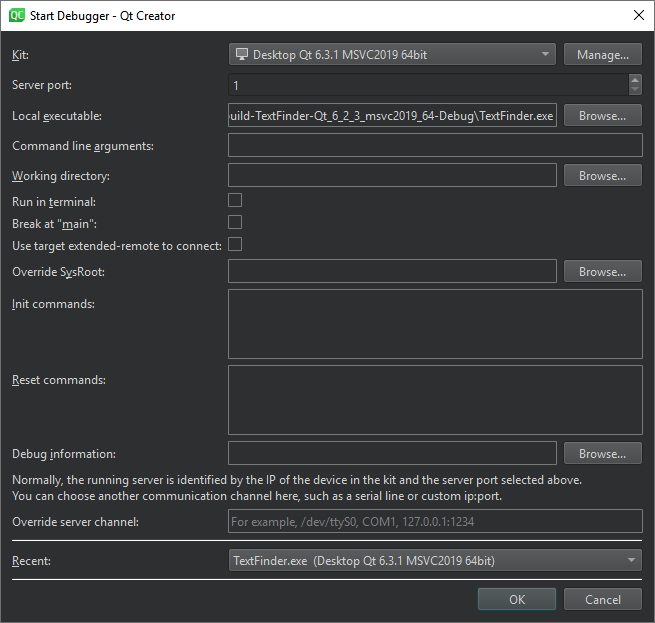
- Select Debug > Start Debugging > Attach to Running Debug Server.

- In the Kit field, select the build and run kit to use for building the project.
- In the Server port field, enter the name of the remote machine and the port number to use.
- In the Local executable field, specify the path to the application executable on the local machine.
- In the Command line arguments field, specify command line arguments to be passed to the executable.
- In the Working directory field, specify the working directory. It defaults to the directory of the build result.
- Select the Run in terminal check box for console applications.
- Select the Break at "main" check box to stop the debugger at the main function.
- Select the Use target extended-remote to connect check box to create the connection in the
target extended-remote mode. In this mode, when the debugged application exits or you detach from it, the debugger remains connected to the target. You can rerun the application, attach to a running application, or use monitor commands specific to the target. For example, GDB does not exit unless it was invoked using the--onceoption, but you can make it exit by using themonitor exitcommand. - In the Override SysRoot field, specify the path to the
sysrootto use instead of the defaultsysroot. - In the Init commands field, enter the commands to execute immediately after the connection to a target has been established.
- In the Reset commands field, enter the commands to execute when resetting the connection to a target.
- In the Debug information field, specify the location for storing debug information. You cannot use an empty path.
- In the Override server channel field, specify a communication channel to use, such as a serial line or custom port.
- In the Recent field, you can select a recent configuration to use.
- Select OK to start debugging.
By default, a non-responsive GDB process is terminated after 20 seconds. To increase the timeout in the GDB timeout field, select Edit > Preferences > Debugger > GDB. For more information about settings that you can specify to manage the GDB process, see Specifying GDB Settings.
For more information about connecting with target extended-remote mode in GDB, see Debugging with GDB: Connecting to a Remote Target.
Using CDB
In remote mode, the local CDB process talks to a CDB process that runs on the remote machine. The process is started with special command line options that switch it into server mode. The remote CDB process must load the Qt Creator CDB extension library that is shipped with Qt Creator:
- Install the Debugging Tools for Windows on the remote machine. The installation folder has the CDB command line executable (
cdb.exe). - Copy the Qt Creator CDB extension library and the dependencies from the Qt installation directory to a new folder on the remote machine (32 or 64 bit version depending on the version of the Debugging Tools for Windows used):
\lib\qtcreatorcdbext32(32 bit)\lib\qtcreatorcdbext64(64 bit)
- Set the _NT_DEBUGGER_EXTENSION_PATH environment variable to point to that folder.
- To use TCP/IP as communication protocol, launch remote CDB as follows:
cdb.exe -server tcp:port=1234 <executable>
- On the local machine running Qt Creator, select Debug > Start Debugging > Attach to Remote CDB Session.
- In the Connection field enter the connection parameters. For example, for TCP/IP:
Server:Port
If you chose some other protocol, specify one of the alternative formats:
tcp:server=Server,port=Port[,password=Password][,ipversion=6]
tcp:clicon=Server,port=Port[,password=Password][,ipversion=6]
npipe:server=Server,pipe=PipeName[,password=Password]
com:port=COMPort,baud=BaudRate,channel=COMChannel[,password=Password]
spipe:proto=Protocol,{certuser=Cert|machuser=Cert},server=Server,pipe=PipeName[,password=Password]
ssl:proto=Protocol,{certuser=Cert|machuser=Cert},server=Server,port=Socket[,password=Password]
ssl:proto=Protocol,{certuser=Cert|machuser=Cert},clicon=Server,port=Socket[,password=Password]
- Click OK to start debugging.
To specify settings for managing the CDB process, select Edit > Preferences > Debugger > CDB. For more information, see Specifying CDB Settings.
© 2023 The Qt Company Ltd. Documentation contributions included herein are the copyrights of their respective owners. The documentation provided herein is licensed under the terms of the GNU Free Documentation License version 1.3 as published by the Free Software Foundation. Qt and respective logos are trademarks of The Qt Company Ltd in Finland and/or other countries worldwide. All other trademarks are property of their respective owners.