Product SiteDocumentation Site

6.5.  Eclipse-Callgraph

Red Hat Enterprise Linux 6 also includes the Eclipse-Callgraph plug-in, which provides a visual function trace of a program. This allows you to view a visualization of selected (or even all) functions used by the profiled application.
Eclipse-Callgraph uses SystemTap to perform a comprehensive function trace within a program. As such, you will need to install SystemTap along with the required kernel information packages. For more information about SystemTap, refer to Section 6.4, “SystemTap ” and other SystemTap documentation provided by Red Hat.
This plug-in allows you to profile C/C++ projects directly within the Eclipse IDE, providing various runtime details such as:

6.5.1. Launching a Profile With Eclipse-Callgraph

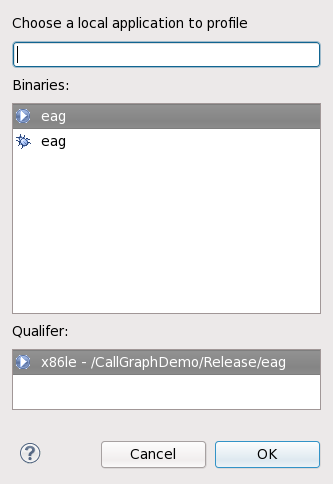
To profile an application with Eclipse-Callgraph, simply right-click on a project and navigate to Profile As > Function callgraph. This will open a dialogue from which you can select an executable to profile.
Eclipse-Callgraph Profile
Figure 6.3. Eclipse-Callgraph Profile

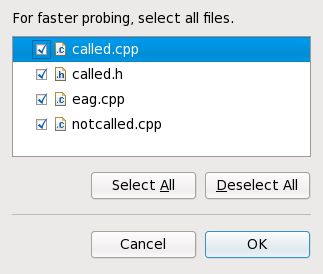
After selecting an executable to profile, Eclipse-Callgraph will ask which files to probe. By default, all source files in the project will be selected.
Selecting Files to Probe
Figure 6.4. Selecting Files to Probe