- Scilab Help
- Graphics
- 2d_plot
- LineSpec
- Matplot
- Matplot1
- Matplot properties
- Sfgrayplot
- Sgrayplot
- champ
- champ1
- champ properties
- comet
- contour2d
- contour2di
- contour2dm
- contourf
- errbar
- fchamp
- fec
- fec properties
- fgrayplot
- fplot2d
- grayplot
- grayplot properties
- graypolarplot
- histplot
- paramfplot2d
- plot
- plot2d
- plot2d2
- plot2d3
- plot2d4
- polarplot
- scatter
LineSpec
to quickly customize the lines appearance in a plot
Description
The LineSpec is an optional argument
that can be used inside a plot
command to customize each new line aspect. It has to
be given as a concatenated string containing information
about color, line style or markers. It is very useful to
quickly specify such basic line properties.
To specify a red longdash-dot with diamond marker, the
string can be 'r-.diam'. As you can
see, a full complete spelling of each property value is
not required but the string, which is a concatenation
(in any order) of these three types of properties, must
remain unambiguous. Furthermore, the string specification
is not case sensitive.
Here is a complete list of the LineSpec
types you can specify (using plot).
- LineStyle:
a string defining the line style. This property is linked to the object's
line_styleproperty (see polyline properties).SpecifierLine Style-Solid line (default) --Dashed line :Dotted line -.Dash-dotted line - Color:
a string defining the line color. This property is linked to the object's
foregroundproperty (see polyline properties).SpecifierColorrRed gGreen bBlue cCyan mMagenta yYellow kBlack wWhite A default color table is used to color plotted curves if you do not specify a color (neither with
LineSpecnor with GlobalProperty). When drawing multiple lines, the plot command automatically cycles through this table. Here are the used colors:RGB0. 0. 1. 0. 0.5 0. 1. 0. 0. 0. 0.75 0.75 0.75 0. 0.75 0.75 0.75 0. 0.25 0.25 0.25 - Marker type:
A string defining the marker type. Note that if you specify a marker without a line style, only the marker is drawn. This property is linked to the object's
mark_styleandmark_modeproperties (see polyline properties).SpecifierMarker Type+Plus sign oCircle *Asterisk .Point xCross 'square'or's'Square 'diamond'or'd'Diamond ^Upward-pointing triangle vDownward-pointing triangle >Right-pointing triangle <Left-pointing triangle 'pentagram' or 'p'Five-pointed star (pentagram) No marker (default)
Examples
clf();
x=1:0.1:10; // Init.
plot(x,sin(x),'r-.>') // plots a dash-dotted line with a right-pointing triangle centered on each points.
clf();
x=1:0.1:10;
// If you specify a marker without a line style, only the marker is drawn
plot(x,sin(x),'d')

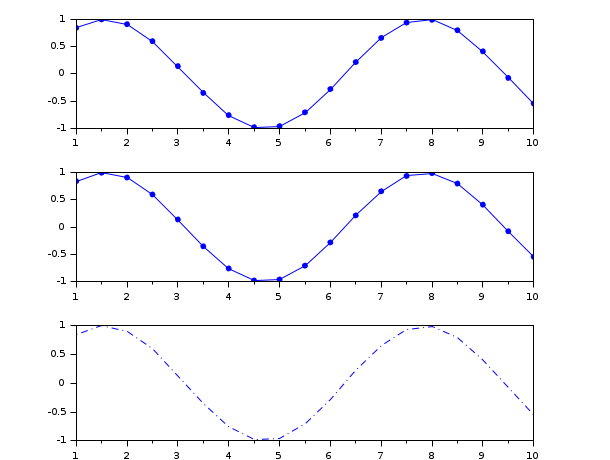
clf();
x = 1:0.5:10; // Init.
// The order of information about color, line style or markers does not matter
// BUT the information must be unambiguous
subplot(311);plot(x,sin(x),'.b-');
subplot(312);plot(x,sin(x),'b.-');
subplot(313);plot(x,sin(x),'b-.');// The point belongs to information about line style (not marker!)
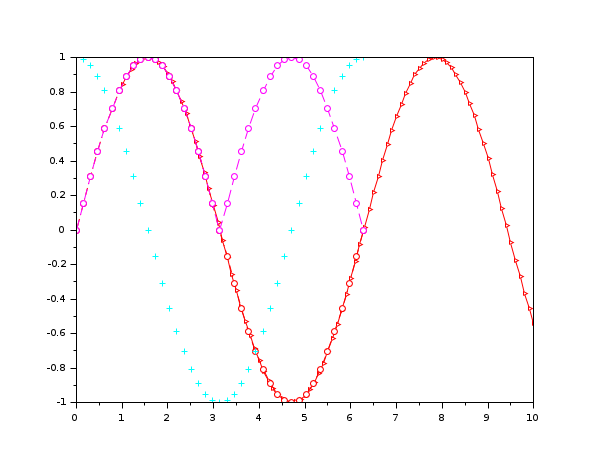
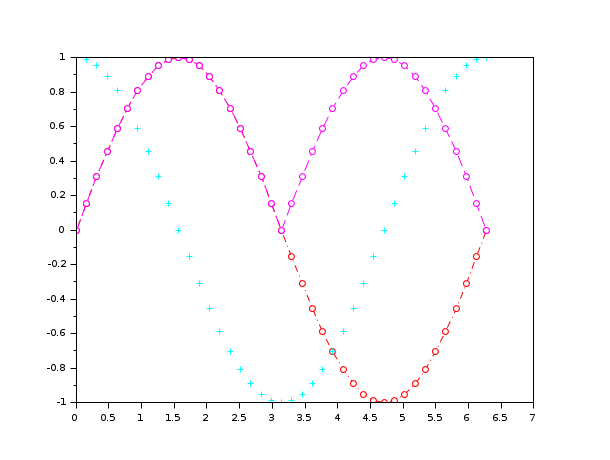
//multiple plots with different LineSpecs
clf();
t=0:%pi/20:2*%pi;
plot(t,sin(t),'ro-.',t,cos(t),'cya+',t,abs(sin(t)),'--mo')
See Also
- color — returns the color id of a color
- GlobalProperty — to customize the objects appearance (curves, surfaces...) in a plot or surf command
- plot — 2D plot
- clf — Clear or reset a figure or a frame uicontrol.
Comments
Add a comment:
Please login to comment this page.