Scilab 6.0.0
- Scilab Help
- Graphics
- 2d_plot
- LineSpec
- Matplot
- Matplot1
- Matplot properties
- Sfgrayplot
- Sgrayplot
- champ
- champ1
- champ properties
- comet
- contour2d
- contour2di
- contour2dm
- contourf
- errbar
- fchamp
- fec
- fec properties
- fgrayplot
- fplot2d
- grayplot
- grayplot properties
- graypolarplot
- histplot
- paramfplot2d
- plot
- plot2d
- plot2d2
- plot2d3
- plot2d4
- polarplot
- scatter
Scilab Help >> Graphics > 2d_plot > plot2d3
plot2d3
2D plot (vertical bars)
Syntax
plot2d3([logflags,] x,y,[style,strf,leg,rect,nax])
plot232(y)
plot2d3(x,y <,opt_args>)
Arguments
- args
see
plot2dfor a description of parameters.
Description
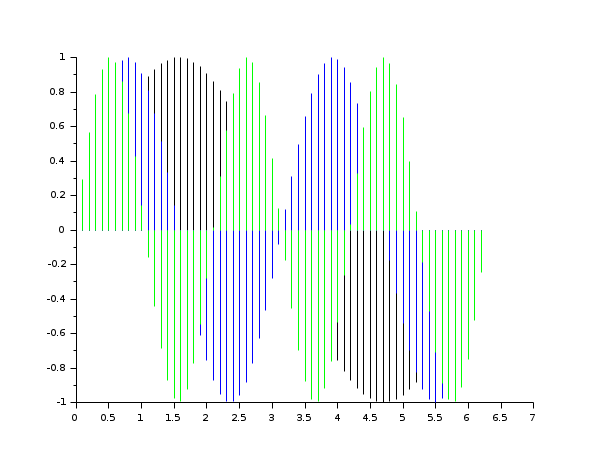
plot2d3 is the same as plot2d but curves are
plotted using vertical bars.
By default, successive plots are superposed. To clear the previous
plot, use clf().
Enter the command plot2d3() to see a demo.
 | Note that all
the modes proposed by plot2dxx (xx = 1 to 4) can be enabled
using plot2d and setting the polyline_style
option to the corresponding number. |
Examples
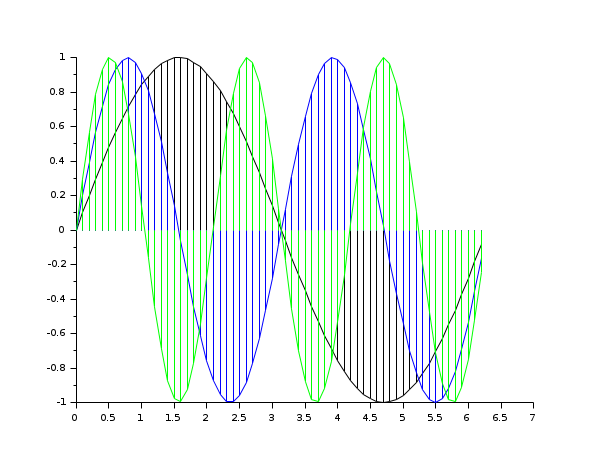
clf()
x = [0:0.1:2*%pi]';
plot2d(x, [sin(x) sin(2*x) sin(3*x)])
e = gce();
e.children(1).polyline_style=3;
e.children(2).polyline_style=3;
e.children(3).polyline_style=3;
See Also
- plot2d — 2D plot
- plot2d2 — 2D plot (step function)
- plot2d4 — 2D plot (arrows style)
- clf — Clear or reset a figure or a frame uicontrol.
- polyline_properties — description of the Polyline entity properties
Comments
Add a comment:
Please login to comment this page.