- Scilab Help
- Graphics
- 2d_plot
- LineSpec
- Matplot
- Matplot1
- Matplot properties
- Sfgrayplot
- Sgrayplot
- champ
- champ1
- champ properties
- comet
- contour2d
- contour2di
- contour2dm
- contourf
- errbar
- fchamp
- fec
- fec properties
- fgrayplot
- fplot2d
- grayplot
- grayplot properties
- graypolarplot
- histplot
- paramfplot2d
- plot
- plot2d
- plot2d2
- plot2d3
- plot2d4
- polarplot
- scatter
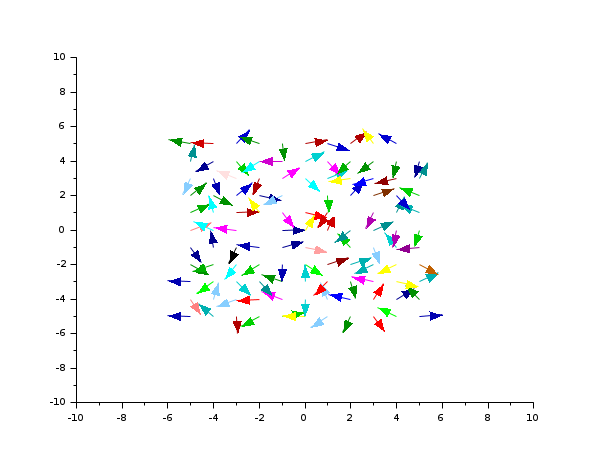
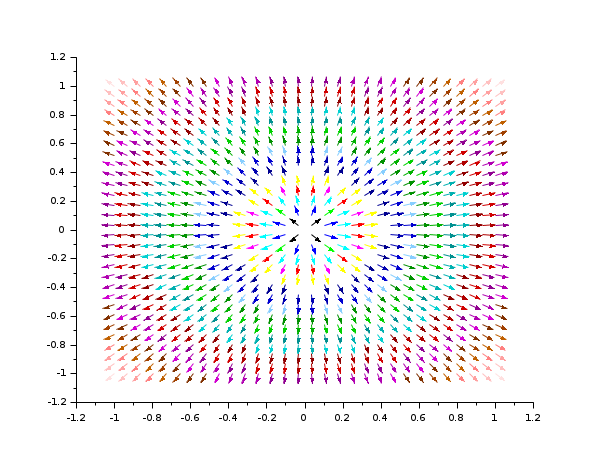
champ1
2D vector field plot with colored arrows
Syntax
champ1(x, y, fx, fy, [arfact, rect, strf])
Arguments
- x, y
two vectors which define the grid.
- fx
a matrix which describes the x component of the vector field.
fx(i,j)is the x component of the vector field at point(x(i),y(j)).- fy
a matrix which describes the y component of the vector field.
fy(i,j)is the y component of the vector field at point(x(i),y(j)).- arfact
an optional argument of type
realwhich gives a scale factor for the display of the arrow heads on the plot (default value is 1.0).- rect
a vector
rect = [xmin, ymin, xmax, ymax]which gives the boundaries of the graphics frame to use.- frameflag
controls the computation of the actual coordinate ranges from the minimal requested values. The associated value should be an integer ranging from 0 to 8.
- axesflag
specifies how the axes are drawn. The associated value should be an integer ranging from 0 to 5.
- strf
a string of length 3 "xyz" which has the same meaning as the
strfparameter ofplot2d. The first characterxhas no effect withchamp1.
Description
champ1 draws a 2D vector field with colored
arrows. The color of the arrows depends on the intensity of the
field.
If you want arrows proportional to the intensity of the field, use
champ.
Enter the command champ1() to see a demo.
Be cautioned about the fact that using meshgrid function before
using champ1 requires adjustment. For more details, see the last example below.
Comments
Add a comment:
Please login to comment this page.