Scilab 6.0.0
Ajuda do Scilab >> Biblioteca de Gráficos > 3d_plot > hist3d
hist3d
representação 3d de um histograma
Seqüência de Chamamento
hist3d(mtx,[theta,alpha,leg,flag,ebox])
hist3d(mtx,<opt_args>)
hist3d(list(mtx,x,y),[theta,alpha,leg,flag,ebox])
hist3d(list(mtx,x,y),<opt_args>)
Parâmetros
- mtx
matriz de tamanho (m,n) definindo o histograma
mtx(i,j)=F(x(i),y(j)), ondexeyasão tomados como0:me0:n.- list(mtx,x,y)
onde f é uma matriz de tamanho (m,n) definindo o histograma
mtx(i,j)=F(x(i),y(j)), com vetoresxeyde tamanho (1,n+1) e (1,m+1).- theta,alpha,leg,flag,ebox
ver
plot3d.
Descrição
hist3d representa um histograma 2d como um esboço
3d. Os valores são associados aos intervalos [x(i) x(i+1)[ X
[y(i) y(i+1)[
.
Entre com o comando hist3d() para visualizar uma
demonstração.
Exemplos
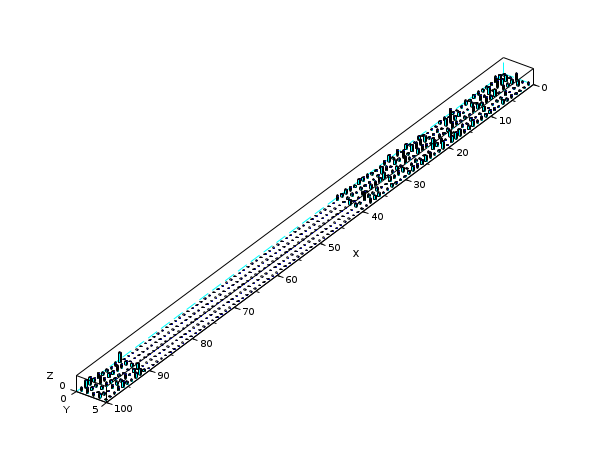
hist3d();
hist3d(10*rand(10,10));
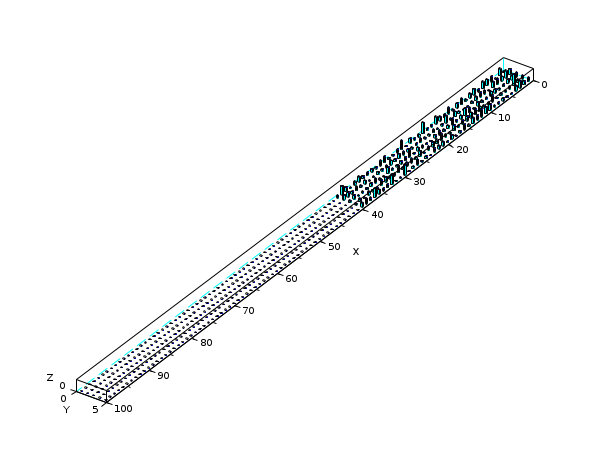
Z = zeros(100,5);
A = abs(rand(40,5));
Z(1:40,:) = A;
Index = find(Z==0);
Z(Index) = %nan;
scf();
hist3d(Z);
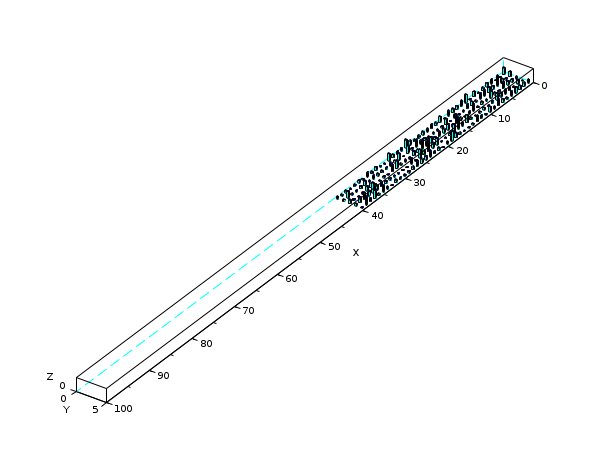
Z = zeros(100,5);
A = abs(rand(40,5));
Z(1:40,:) = A;
A = abs(rand(10,5));
Z(91:100,:) = A;
scf();
hist3d(Z);
Autores
Steer S. & JPhilippe C.
Comments
Add a comment:
Please login to comment this page.