scatter3
3D scatter plot
Syntax
p = scatter3(x,y,z,<s>,<c>,<"fill">,<marker>,<marker_property,value>)
p = scatter3(<axes_handle>,...)
Arguments
- x
A column or row vector of n real numbers specifying the x positions of the markers center. x, y and z must be vectors of the same length.
- y
A column or row vector of n real numbers specifying the y positions of the markers center. x, y and z must be vectors of the same length.
- z
A column or row vector of n real numbers specifying the y positions of the markers center. x, y and z must be vectors of the same length.
- <s>
Specifying the sizes of the markers. To plot each marker with equal size, specify s as a scalar. To plot each marker with a different size, specify s as a vector with length equal to the length of x, y and z. The units for s is points squared with a default value of 36 points squared. The size equals the area of the circle surrounding the marker.
- <c>
Specifying the colors of the markers. To plot each marker with the same color, specify c as a string representing a known color, see color_list. A color can also be specified by a vector of 3 RGB values. RGB values correspond to red, green and blue intensity between 0 and 1. To plot each marker with a different color, specify c as a vector with length equal to the length of x, y and z. The values of c are linarly mapped to the colors in the current colormap. Colors can also by specified by a matrix of RGB values or a vector of strings representing known colors. A matrix of RGB values has 3 columns and the number of rows equals the length of x, y and z. The default color is "blue".
- <"fill">
This string indicates that the markers are filled with colors. The markers background colors are set using the values of c. If c is not specified the fill color can be defined by the marker property "markerFaceColor" or "markerBackgroundColor". The default color is "blue".
- <marker>
Select the type of the marker. The figure below shows the 15 different marker types.
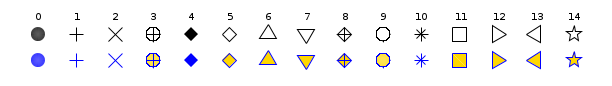
Marker types are specified by strings, see the table below.
String Marker type "."Point "+"Plus sign "x"Cross "circle plus"Circle with plus "filled diamond"Filled diamond "d"or"diamond"Diamond "^"Upward-pointing triangle "v"Downward-pointing triangle "diamond plus"Diamond with plus "o"Circle (default) "*"Asterisk "s"or"square"Square ">"Right-pointing triangle "<"Left-pointing triangle "pentagram"or"p"Five-pointed star - <marker_property,value>
A sequence of property value pairs can be used to specify type, color and line width of the markers.
- <"marker",value> or <"markerStyle",value>
Specify the type of the marker, see the table above.
- <"markerEdgeColor",value> or <"markerForground",value>
Specify the foreground color of the marker. A color can be specified by a string representing a known color, see color_list. A color can also be specified by a vector of 3 RGB values. RGB values correspond to red, green and blue intensity between 0 and 1. This option is superseded by argument c.
- <"markerFaceColor",value> or <"markerBackground",value>
Specify the background color of the marker. A color can be specified by a string representing a known color, see color_list. A color can also be specified by a vector of 3 RGB values. RGB values correspond to red, green and blue intensity between 0 and 1. This option is superseded by argument c.
- <"linewidth",value> or <"thickness",value>
Specify the thickness of the edge of the marker. The unit for the value is one point.
- <axes_handle>
This optional argument forces the scatter plot to appear inside the selected axes given by
axes_handlerather than inside the current axes, see gca.- <p>
Returns a handle to the created polyline.
Description
scatter3(x,y) creates a scatter plot with markers at the locations specified by x and y.
The default type of the marker is a circle, the default color is "blue" and the default size is 36.
This means the circle surrounding the marker has an area of 36 points squared.
Using scatter3(x,y,s,c) different sizes and colors for each marker can be specified.
There are many different ways to specify marker types, marker colors and marker sizes.
For more details see the description of the arguments and the examples.
Remarks
If you want to specify colors without specifying sizes use scatter3(x,y,[],c).
Examples
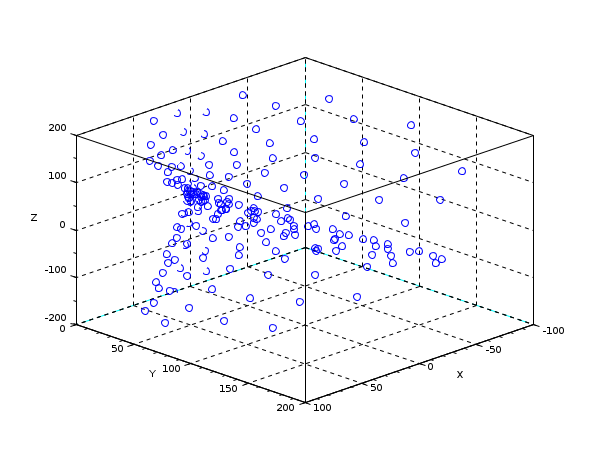
Create 3D scatter plot
// x, y and z initialisation
t = 1:200
x = t.*cos(t).*sin(t)
y = t.*sin(t).*sin(t)
z = t.*cos(t)
// create 3D scatter plot
scatter3(x,y,z)
// modify rotation angles
set(gca(),"rotation_angles",[60,45])
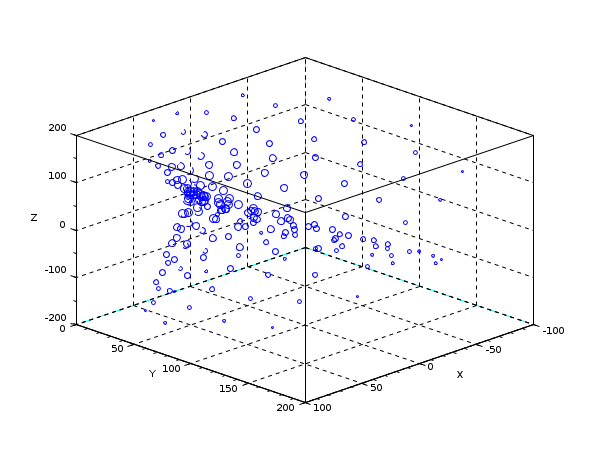
Vary marker size
// x, y and z initialisation
t = 1:200
x = t.*cos(t).*sin(t)
y = t.*sin(t).*sin(t)
z = t.*cos(t)
// size according to radius
s = linspace(50,1,length(t))
// create 3D scatter plot
scatter3(x,y,z,s)
// modify rotation angles
set(gca(),"rotation_angles",[60,45])
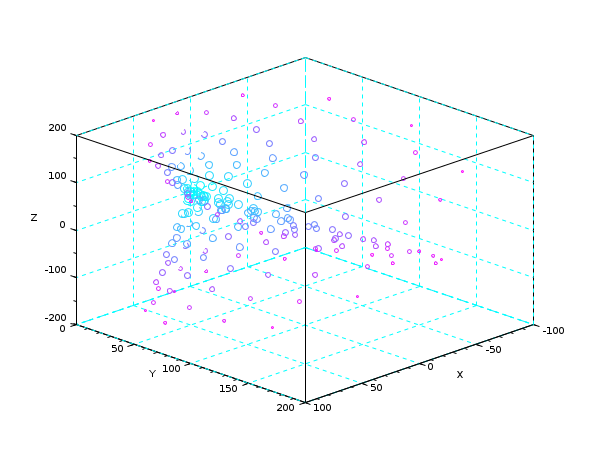
Vary marker size and color
// x, y and z initialisation
t = 1:200
x = t.*cos(t).*sin(t)
y = t.*sin(t).*sin(t)
z = t.*cos(t)
// size according to radius
s = linspace(50,1,length(t))
// set color map
set(gcf(),"color_map",coolcolormap(64))
// color according to radius
c = t
// create 3D scatter plot
scatter3(x,y,z,s,c)
// modify rotation angles
set(gca(),"rotation_angles",[60,45])
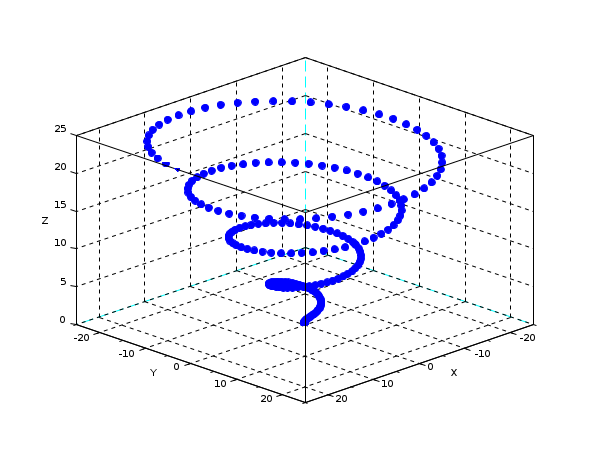
Fill the markers
// x, y and z initialisation
z = linspace(0,25,200)
x = z.*cos(z)
y = z.*sin(z)
// create 3D scatter plot
scatter3(x,y,z,"fill")
// modify rotation angles
set(gca(),"rotation_angles",[60,45])
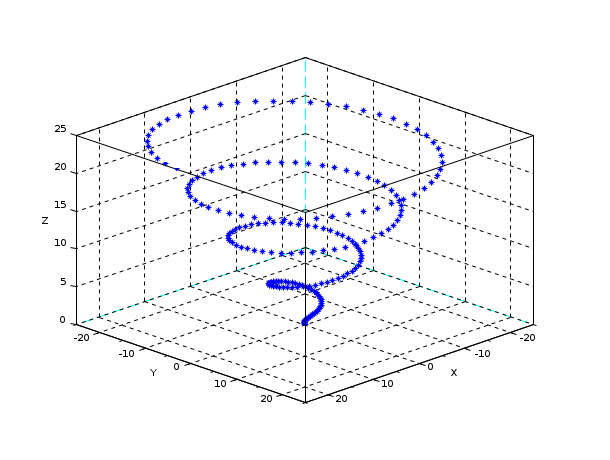
Specify marker symbol
// x, y and z initialisation
z = linspace(0,25,200)
x = z.*cos(z)
y = z.*sin(z)
// create 3D scatter plot
scatter3(x,y,z,"*")
// modify rotation angles
set(gca(),"rotation_angles",[60,45])
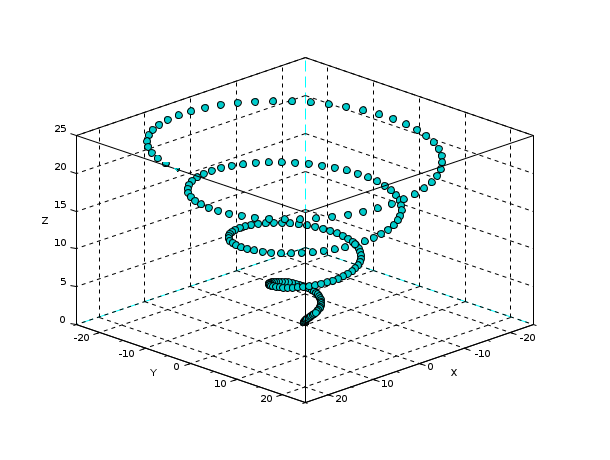
Change marker edge and face color
// x, y and z initialisation
z = linspace(0,25,200)
x = z.*cos(z)
y = z.*sin(z)
// create 3D scatter plot
scatter3(x,y,z,...
        "markerEdgeColor","black",...
        "markerFaceColor",[0 .8 .8])
// modify rotation angles
set(gca(),"rotation_angles",[60,45])
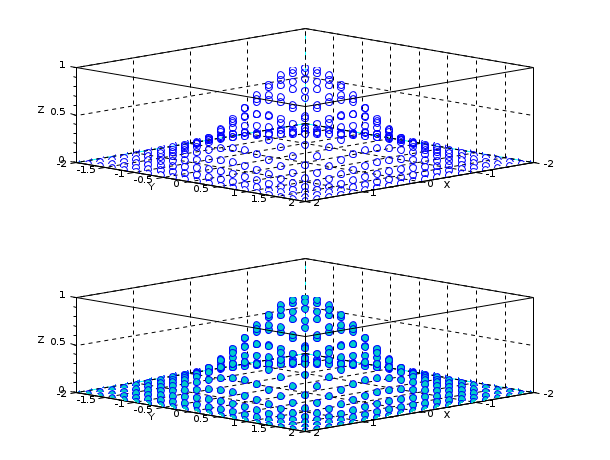
Specify subplot for scatter plot
// x, y and z initialisation
n = 20
[x,y] = meshgrid(linspace(-2,2,n))
z = exp(-x.^2-y.^2)
// create 3D scatter subplot
subplot(2,1,1)
scatter3(gca(),x(:),y(:),z(:))
// modify rotation angles
set(gca(),"rotation_angles",[60,45])
// create 3D scatter subplot
subplot(2,1,2)
scatter3(gca(),x(:),y(:),z(:),"markerFaceColor",[0 .8 .8])
// modify rotation angles
set(gca(),"rotation_angles",[60,45])
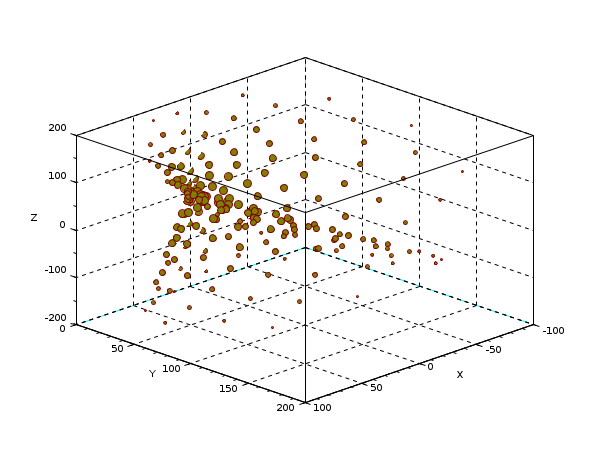
Modify scatter plot after creation
// x, y and z initialisation
t = 1:200
x = t.*cos(t).*sin(t)
y = t.*sin(t).*sin(t)
z = t.*cos(t)
// size according to radius
s = linspace(50,1,length(t))
// create 3D scatter plot
scatter3(x,y,z,s)
// modify rotation angles
set(gca(),"rotation_angles",[60,45])

// modify ployline
p.mark_foreground = addcolor([0.5 0 0])
p.mark_background = addcolor([0.5 0.5 0])
See Also
- scatter — 2D scatter plot
- param3d — esboço 3d de uma curva parametrizada
- gca — Retorna o manipulador da entidade Axes corrente
- gcf — Retorna o manipulador da janela GUI ou de gráficos corrente.
- color_list — Lista dos nomes das cores
- polyline_properties — description of the Polyline entity properties
History
| Versão | Descrição |
| 6.0.0 | Function scatter3 introduced. |
Comments
Add a comment:
Please login to comment this page.