Scilab 6.0.0
- Справка Scilab
- Графики
- 2d_plot
- ВидЛинии
- свойства Matplot
- Sfgrayplot
- champ
- champ1
- comet
- contour2d
- contour2di
- contourf
- errbar
- Matplot
- Matplot1
- Sgrayplot
- champ properties
- contour2dm
- fchamp
- fec
- fec properties
- fgrayplot
- fplot2d
- grayplot
- grayplot properties
- graypolarplot
- histplot
- paramfplot2d
- plot
- plot2d
- plot2d2
- plot2d3
- plot2d4
- polarplot
- scatter
Справка Scilab >> Графики > 2d_plot > plot2d4
 Examples:
plot2d4
2D plot (arrows style)
Syntax
plot2d4([logflag,] x,y,[style,strf,leg,rect,nax])
plot2d4(y)
plot2d4(x,y <,opt_args>)
Arguments
- args
see
plot2dfor a description of parameters.
Description
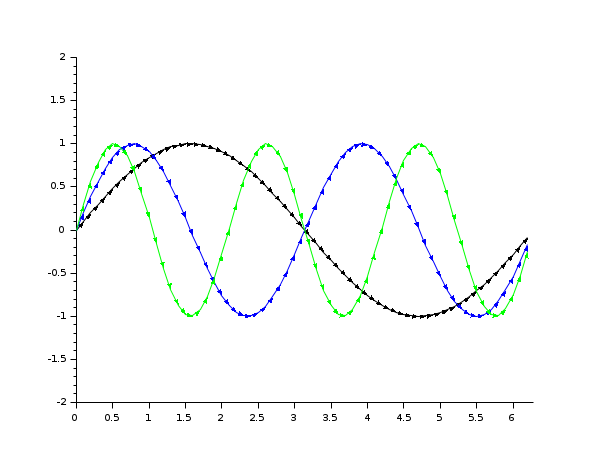
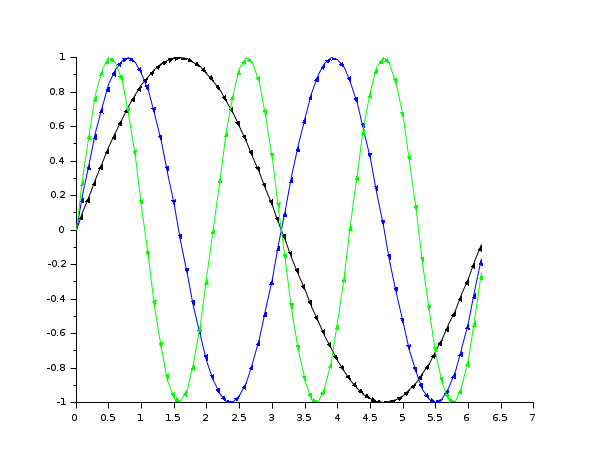
plot2d4 is the same as plot2d but curves are
plotted using arrows style. This can be useful when plotting solutions of
an ODE in a phase space.
By default, successive plots are superposed. To clear the previous
plot, use clf().
Enter the command plot2d4() to see a demo.
 | Note that all
the modes proposed by plot2dxx (xx = 1 to 4) can be enabled
using plot2d and setting the polyline_style
option to the corresponding number. |
Examples
Demo: plot2d4();
Examples:
// compare the following with plot2d + .polyline_style=4
clf
subplot(2,1,1)
x = [0:0.1:2*%pi]';
plot2d4(x,[sin(x) sin(2*x) sin(3*x)])

subplot(2,1,2)
plot2d(x,[sin(x) sin(2*x) sin(3*x)])
e = gce();
e.children.polyline_style=4;
See Also
- fchamp — direction field of a 2D first order ODE
- plot2d — 2D plot
- plot2d2 — 2D plot (step function)
- plot2d3 — 2D plot (vertical bars)
- subplot — divide a graphics window into a matrix of sub-windows
- clf — Clear or reset a figure or a frame uicontrol.
- polyline_properties — description of the Polyline entity properties
Comments
Add a comment:
Please login to comment this page.