Scilab 6.0.0
- Справка Scilab
- Графики
- 2d_plot
- 3d_plot
- geometric_shapes
- interaction
- window_control
- annotation
- axes_operations
- axis
- bar_histogram
- Color management
- Datatips
- figure_operations
- handle
- lighting
- load_save
- pie
- polygon
- property
- text
- transform
- ГлобальноеСвойство
- Графики: введение
- свойства составного объекта "Compound"
- Графические объекты
- pixel_drawing_mode
- twinkle
- xchange
- xdel
- object editor
- Segments properties
- xget
- xgetech
- xgraduate
- xgrid
- xname
- xnumb
- xsegs
- xset
- xsetech
Справка Scilab >> Графики > xgrid
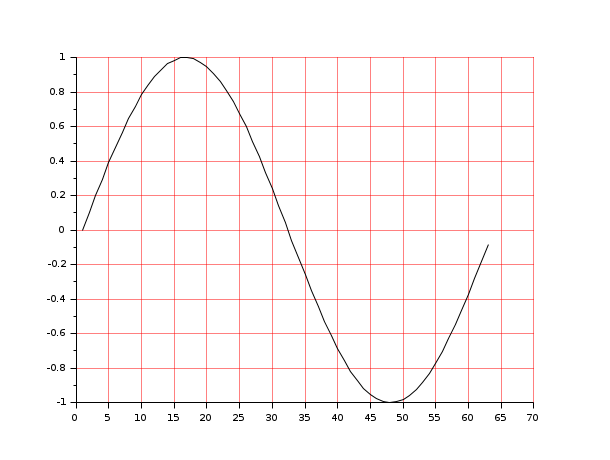
xgrid
add a grid on a 2D or 3D plot
Syntax
xgrid([color] [, thickness] [, style])
Arguments
- color
an integer or a row matrix.
- thickness
a real or a row matrix.
- style
an integer or a row matrix.
Description
xgrid adds a grid on a 2D or 3D plot.
d for each axis).
color is the colors id to use for the grid plotting (if color is a scalar then the same color is used for each axis).
thickness is the thickness to use for the grid plotting (if thickness is a scalar then the same thickness is used for each axis).
style is the style to use for the grid plotting (if style is a scalar then the same style is used for each axis). Available styles are the same as for line_style property (see axes_properties).
See Also
- axes_properties — description of the axes entity properties
- plot2d — 2D plot
History
| Version | Description |
| 5.5.0 | Arguments thickness and style introduced. |
Comments
Add a comment:
Please login to comment this page.