When discussing networks, it is useful to borrow some basic ideas and definitions from the mathematics of graph theory, which is concerned with the description of abstract collections of nodes and connections.
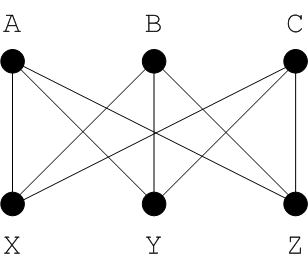
A graph is a mathematical entity consisting of a vertex set (analogous to the set of nodes in a network) and an edge set (analogous to the set of connections between network nodes). A graph can therefore be used to describe the underlying topology of a network. For example, consider the graph shown in Figure 2.6.
Formally, the utility graph[1] consists of the following:
The Vertex set,
{A,B,C,X,Y,Z}.The Edge set,
{{A,X},{A,Y},{A,Z},{B,X},{B,Y},{B,Z},{C,X},{C,Y},{C,Z}}, where each edge is represented by the pair of vertices it joins. For example, the join from vertexAto vertexXis represented as the edge,{A,X}.
A directed graph or digraph is a
graph that has a direction associated with each edge. In other words, each edge is
represented by an ordered pair of vertices, such as (A,B). In a
diagram, the order of the vertex pair (A,B) is indicated by an arrow
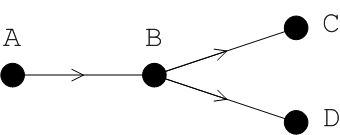
pointing from A to B. For example, Figure 2.7 shows a simple digraph whose edge set is equal to the set of ordered pairs,
{(A,B),(B,C),(B,D)}.
Given that each simple network connector has a particular direction associated with it (which is the direction of message propagation), it follows that digraphs provide a natural mathematical model for broker network topologies.
In graph theory, the distance, d(X,Y), between
two vertices, X and Y, is the minimum number of edges that
must be traversed in order to get from vertex X to vertex
Y.
For example, if you consider the utility graph shown in Figure 2.6, you can see that d(A,X)=1
and d(X,Y)=2. The shortest distance between X and
Y is realised by any of the paths XAY,
XBY, or XCY.
The concept of distance is useful in network theory, because it corresponds to the length of the shortest (optimal) route between any two nodes in a network.
The diameter of a graph is the greatest distance between any pair of vertices.
For example, the utility graph of Figure 2.6 has a diameter of 2.
The network time-to-live (TTL) is a message property that determines the maximum
number of hops that a message can make through a broker network. When a message is
originally generated, it is assigned a TTL value (as specified by the
networkTTL attribute on the corresponding network connector). Each
time the message traverses a hop from one broker to the next, the message's TTL
property is decremented by 1 and when the TTL property reaches 0, the message cannot
be forwarded to another broker (though it can be sent to a
local consumer).
It follows from this definition that, if the graph-theoretical distance between two brokers is greater than a message's TTL value, it will not be possible for the message to travel all the way from one broker to the other. In fact, it is possible to state the following general rule for the network TTL: to ensure that a message can reach any node in a broker network, the message's TTL value must be greater than or equal to the diameter of the network.
The following examples illustrate some of the common graph topologies encountered real-world networks:
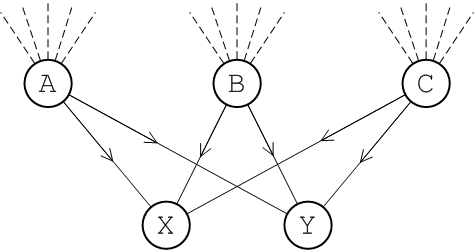
If you anticipate that your system will have a large number of incoming connections that would overwhelm a single broker, you can deploy a concentrator topology to deal with this scenario, as shown in Figure 2.8.
The idea of the concentrator topology is that you deploy brokers in two (or more)
layers in order to funnel incoming connections into a smaller collection of
services. The first layer consists of a relatively large number of brokers, with
each broker servicing a large number of incoming connections (from producers
P1 to Pn). The next layer consists of a smaller number
of brokers, where each broker in the first layer connects to all of the brokers in
the second layer. With this topology, each broker in the second layer can receive
messages from any of the producers.
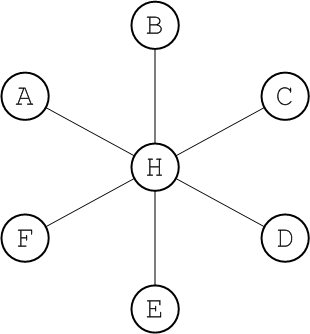
The hub and spokes, as shown in Figure 2.9, is a topology that is relatively easy to set up and maintain. The edges in this graph are all assumed to represent duplex network connectors.
This topology is relatively robust. The only critical element is the hub node, so you would need to focus your maintenance efforts on keeping the hub up and running. Routes are determinate and the diameter of the network is always 2, no matter how many nodes are added.
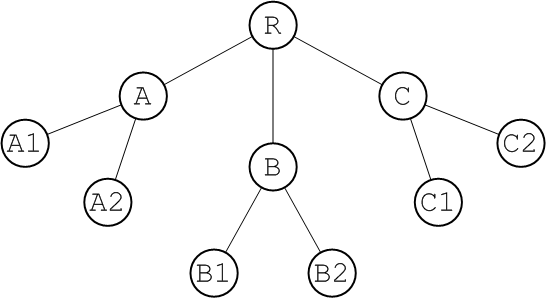
The tree, as shown in Figure 2.10, is a topology that arises naturally when a physical network grows in an informal manner.
For example, if the network under consideration is an ethernet LAN, R
could represent the hub in the basement of the IT department's building and
A could represent a router in the ground floor of another building.
If you want to extend the LAN to the first and second floor of building
A, you are unlikely to run dedicated cables back to the IT hub for
each of these floors. It is more likely that you will simply plug a second tier of
routers, A1 and A2, into the existing router,
A, on the ground floor. In this way, you effectively add another
layer to the tree topology.
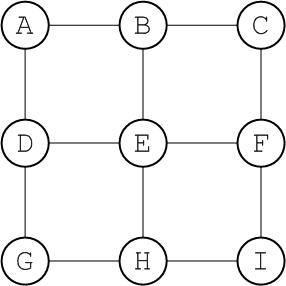
The mesh, as shown in Figure 2.11, is a topology that arises naturally in a geographic network, when you decide to link together neighbouring hubs.
The diameter of a mesh increases whenever you add a node to its periphery. You must, therefore, be careful to set the network TTL sufficiently high that your network can cope with expansion. Alternatively, you could set up some mechanism for the central management of broker configurations. This would enable you to increase the network TTL for all of the brokers simultaneously.
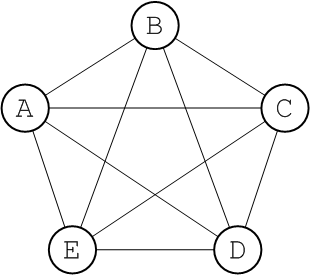
In graph theory, the complete graph on n
vertices is the graph with n vertices that has edges
joining every pair of vertices. This graph is denoted by the symbol,
Kn. For example, Figure 2.12 shows the graph,
K5.
Every complete graph has a diameter of 1. Potentially, a network that is a complete graph could be difficult to manage, because there are many connections between broker nodes. In practice, though, it is relatively easy to set up a broker network as a complete graph, if you define all of the network connectors to use a multicast discovery agent (see Multicast discovery agent).
[1] The name of this graph derives from a puzzle, where you are asked to find a way to connect each of the three houses, A, B, and C, to the three utilities, X, Y, and Z, without having any of the wires or pipes cross over (in graph theory, a graph that can be drawn without edge crossings is called planar).


