

|
|
|
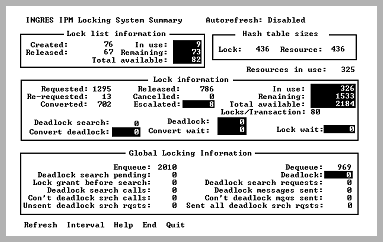
The Locking System Summary screen appears when you select Locking System Summary from the Lock Info Menu screen.
The data on this screen helps you to determine which locking parameters need to be adjusted.
Because there is currently no way to view all of the locking parameters used to configure the locking system, keep a record of the parameters in a prominent place when viewing this screen.
Use autorefresh when monitoring this information. The screen autorefreshs if the -r flag was specified at startup or the Display Refresh field on the Option Selection screen was changed to a number between 1 and 999 seconds. For more information, see Option Selection Screen.
When tests or benchmarks are run, monitor the locking system activity during the test by selecting the Interval menu item and selecting the Start_Now menu item. IPM displays the statistics accumulated since the start time.
If the Interval option was previously enabled, the start time and current time fields appear in the upper right-hand corner of the Locking System Summary screen. To reset the start time (which is the time when the Start_Now menu item is selected), select the Interval menu item and the Start_Now menu item.
The start time and statistics obtained at the start time remains unchanged until the Begin_Now or Since_Startup menu items are selected or the user exits IPM. This allows other functions (for example, logging, other locking, or server information) to be used while accumulating statistics. When the Locking System Summary screen is displayed at a later time, the running totals since the start time are not lost.
When displaying statistics over an interval, you must set the Autorefresh option. This causes the display to be automatically updated.
When this screen is displayed on VMS cluster installations, additional fields are displayed. For more information, see VMS Cluster Only Fields (VMS Only).
|
|
|
By observing the fields on the Locking System Summary, you can spot conditions when more locking system resources need to be made available. You reconfigure the locking system using rcpconfig. For more information, see the System Administrator Guide.
The Locking System Summary has the following fields:
The number of times a lock list was created on behalf of a server, session, or transaction.
The number of times a release of a lock list occurred on behalf of a server, session, or transaction.
The number of lock lists in use by a server, session, or transaction.
The number of lock lists remaining to be used by a server, session, or transaction.
The number of new lock requests that the locking system processed.
The number of times an implicit lock conversion request was issued on a resource that the lock list already had locked. Implicit lock conversions can occur when a request is made on a page for update that was previously requested for read.
The number of times an explicit lock conversion request is made to change a lock mode on a physical lock from one mode to another. These types of requests occur as a result of a physical lock being converted during an existing transaction to lower or higher modes.
The number of times a specific logical lock is released, as opposed to a full, partial, or physical lock release.
The number of times a lock request was cancelled due to a timeout or interrupt.
The number of times a partial release occurred to allow escalation of lock granularity from page to table level.
The number of locks in use by a server, session, or transaction.
The number of locks remaining to be used by a server, session, or transaction.
The total sum of resources in use, locks in use, and locks remaining
The number of times a deadlock search was initiated.
The number of times that deadlock existed.
The number of times an existing lock waited for conversion to a different lock mode.
The number of times a request for conversion turned into a deadlock.
The number of times a new lock request had to wait to be granted.
|
|
|
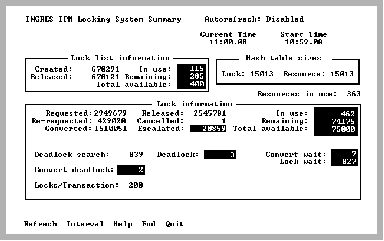
The following shows the Locking System Summary as it appears when IPM is running on a VMS cluster installation.
The Global Locking Information box appears only in VMS cluster installations. The fields in this area are as follows:
The number of times the VMS lock manager was called to map Ingres locks onto their VMS counterparts through the use of VMS system calls.
The number of times the VMS lock manager was called to dequeue VMS locks using VMS system calls that occurred as a result of a change in status of the corresponding Ingres lock.
The number of pending global deadlock search requests.
The number of global deadlocks that occurred.
The number of global locks that were granted without contention as a result of the lock request.
The number of times a global deadlock search was initiated.
The number of times the Cluster Server Process (CSP) requested deadlock search information.
The number of times a global deadlock message was built up and sent.
The number of times a continue global deadlock search request was issued in response to an unresolved global contention problem.
The number of continue global deadlock search messages that were sent due to an unresolved global contention problem.
The number of unsent global deadlock search messages found.
The number of times that global deadlock search requests were more than 50% of the total number of transactions.
|
|
|
The Locking System Summary has the following menu items:
Queries the locking system for locking summary information. Even if the autorefresh option is set, this menu item can still be selected at any time.
Sets a start time to begin measuring locking summary information. Otherwise, the information displayed is activity since the locking system was started.
For more information on this menu item, see Interval Option (Locking Systerm Summary).
Displays help screens.
Return to the Lock Info Menu.
Exits IPM.
|
|
|
The Interval menu item displays a submenu that allows a start time to be set. This allows display of summary information that occurred since the selected start time. Choices available from the submenu are:
Fields displaying cumulative statistical data reflect activity from initial Ingres startup. This is the default mode when starting IPM. Current and Start time fields are not displayed.
Enables the Interval option and sets a new baseline for cumulative statistical data. Screens displaying cumulative statistical information display Current Time and Starting Time in the upper right hand corner, giving the current bounds of the interval.
Returns to the previous menu.
When the Interval option is enabled, the following screen is displayed:
|
|
|
To display a summary of locking information
Select the Locking System Summary screen from the Lock Info Menu screen.
The Locking System Summary screen is displayed.