|
|
|
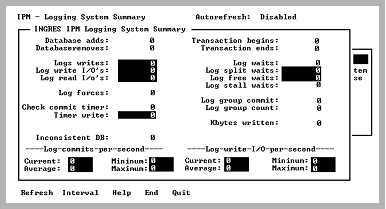
The Logging System Summary screen appears when you select Summary from the Log Info Menu screen.
The data on this screen helps you to determine which logging parameters need to be adjusted.
Because there is currently no way to view all of the logging parameters used to configure the logging system, keep the parameters in a prominent place when viewing this screen.
This screen automatically refreshes the information if the -r flag was specified at startup or the Display Refresh field on the Option Selection screen was changed to a number between 1 and 999 seconds. For more information, see Option Selection Screen.
When tests or benchmarks are run, monitor the locking system activity during the test by selecting the Interval menu item and selecting the Start_Now menu item. IPM displays the statistics accumulated since the start time.
In addition, if the Interval option was previously enabled, the start time and current time fields appear in the upper right-hand corner of the Logging System Summary screen. To reset the start time (which is the time when the Start_Now menu item is selected), select the Interval menu item followed by the Start_Now menu item.
The start time and statistics obtained at the start time remains unchanged until the Begin_Now or Since_Startup menu items are selected or the user exits IPM. This allows other functions (for example, locking, other logging, or server information) to be used while accumulating statistics. When the Logging System Summary screen is displayed at a later time, the running totals since the start time are not lost.
When displaying statistics over an interval, you must set the Autorefresh option, which causes the display to be automatically updated.
|
|
|
The Logging System Summary screen has the following fields:
The number of databases added to the logging system.
The number of databases removed from the logging system. This means the last user of a database has disconnected from Ingres. The number of databases currently open is the difference between Database adds and Database removes.
The number of log writes. This is a memory-to-memory write.
UNIX: Shows the number of log writes into shared memory.
VMS: Shows the number of log writes into the non-paged pool.
The number of write I/Os actually done to the log file. This is a physical write.
The number of read I/Os actually done to the log file. This is a physical read.
The number of log force requests. These occur under the following circumstances:
The number of times that the timer, associated with the group commit, is completed. This does not necessarily mean that a write to the log file occurs. A write does not occur if the log buffer, that initiated the timer, is full. This timer is activated only when there are multiple transactions active in the logging system that can cause delays for users because of group commit.
The timer wakes up every 10 milliseconds and checks if there is a buffer waiting to be forced to the log file. If a buffer is found, the timer waits for 20 additional milliseconds before calling the routine to write out the buffer.
The number of times a group commit timer check resulted in a group commit.
The number of inconsistent database occurrences. This number must be zero. If it is not, check the errlog.log file.
UNIX: The errlog.log file is in $II_SYSTEM/INGRES/files
VMS: The errlog.log file is in II_SYSTEM:[INGRES.FILES]
The number of transactions started.
The number of commits or transactions ended. This value represents user-initiated transaction ends such as commits, rollbacks, and interrupts. It does not include system-generated transaction ends such as LOG-FULL. The difference between Transaction begins and Transaction ends is the number of current transactions.
The number of times any event wait condition requires a log buffer write to stall. These events encompass things like LOG-FULL, CP writing, RECOVERY, archiving required, FREE WAIT for log buffer, OPENDB wait, log buffer SPLIT WAIT, and wait for log I/O to complete (the log buffer being written to the log file).
The number of times a log split operation is delayed due to the lack of free log buffers. This must be watched because the logging system cannot proceed with the log record split until a free buffer is available. You can reduce this by increasing the number of log buffers or increasing their size.
The number of times all the log buffers are either in force mode or unavailable for writing. Only one log buffer is currently written to at a time. If this state is frequent (more than five per minute during busy times), an increase in the number of log buffers is the solution. Remember that an increase in the number of buffers requires more memory (number_of_buffers x buffer_size). This condition affects throughput to the log file. For more information, see the System Administrator Guide for more information.
The number of times stalled while making requests to the logging system. This occurs while consistency points are being taken or during LOG-FULL conditions. This is acceptable (not in the LOG-FULL case) and these types of stalls only last for a fraction of a second. If 100 sessions are stalled for one event, this count is incremented by 100. Only stalls due to LOG-FULL events are reflected in this value.
For more information on log stall waits see, Logging System Header Screen. Depending upon the causes of a Log stall wait, the following statuses are shown in the Logging System Header screen:
The log file is full.
The log file is overly full while executing a consistency point (CP). The CP must complete before log space can be released. The status LOGFULL, ARCHIVE is also be displayed.
The log file becomes full and journaled transactions must be archived to free up log space. When the archiver is done, log file space is released.
The number of times that multiple transactions are participating in a log buffer flush to the log file. The value is incremented every time a write to disk completes a group commit (piggyback write).
The number of transactions that are participating in the flush to the log file. If one group commit event writes on behalf of ten sessions (threads), this number is incremented by ten. The ratio between this number and the Log group commit indicates how effective group commit is (for example, group count/group commit indicates the number of log write requests by threads that are satisfied per group commit write).
The number of kilobytes written to the log file.
|
|
|
The menu items available on this screen are:
Queries the logging system for logging summary information. Even if the autorefresh option is set, this menu item can still be selected at any time.
Sets a start time to begin measuring logging summary information. Otherwise, the information displayed is activity since the logging system was started.
For more information on this menu item, see Interval Option (Logging System Summary).
Displays help screens.
Returns to the Log Info Menu screen.
Exits IPM.
|
|
|
The Interval menu item on the Logging System Summary displays a submenu that allows a start time to be set. This lets you display information that occurred since the selected start time. Options available from the submenu are:
Fields displaying cumulative statistical data reflect activity from initial Ingres startup. This is the default mode when starting IPM. Current and Start time fields are not displayed.
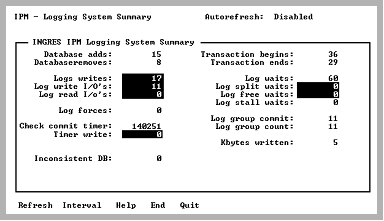
Enables the Interval option and sets a new baseline for cumulative statistical data. Screens displaying cumulative statistical information display Log commits per second and Log write I/O per second at the bottom of the main screen.
Returns to the previous menu.
When the Interval option is enabled, the Logging System Summary appears as follows. Two additional items appear at the bottom of the main screen: Log commits per second and Log write I/O per second.