|
|
|
The Logging System Header screen appears when you select Header from the Log Info Menu screen. This screen displays the current state of the logging system and critical points in the log file.
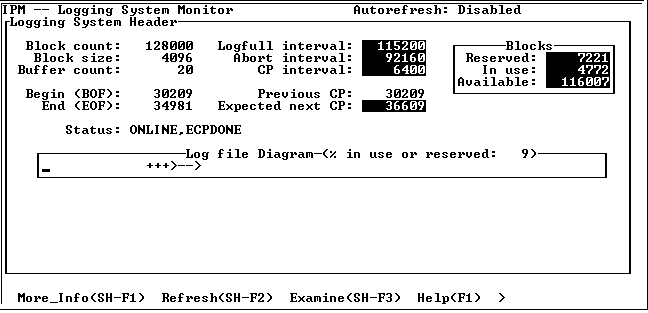
The Log file Diagram displays a logical view of the log file in use. The Log file Diagram starts at page 1 of the log file through the page specified by the Block count field. In the sample screen, the upper end of the diagram represents page 1024. The area of the diagram covered by the arrow (>----->) is the area of the log file in use (in this case from page 12 to 22). As the BOF (beginning of file) and EOF (end of file) move, so does the arrow.
This screen can be displayed during benchmarks, tests, or daily use to help the system administrator determine if the log file is near FORCE_ABORT. The Blocks in use field shows the actual number of blocks in use. If it is greater than the value in the Abort interval field, IPM displays a warning indicator. The same occurs when the Blocks in use exceeds the value in the Logfull interval field. The system administrator can decide to increase the size of the log file if the percentage of the log file in use approaches the Abort interval.
This screen autorefreshes the information if the -r flag was specified at startup or the Display Refresh field on the Option Selection screen was changed to a number between 1 and 999 seconds. For more information, see Option Selection Screen.
|
|
|
The Logging System Header screen has the following fields:
The number of blocks in the log file. This value is also specified when running IIBUILD or rcpconfig. Multiply by the block size to get the log file size in bytes.
The log file block size in bytes. This value is specified when running the install or configure program.
The number of log buffers. These are the same size as the log file block size.
The logging system parameter LOG_FULL_LIMIT occurs. When the Blocks in use field is equal to this value, all transaction activity is halted. A warning field is displayed in the lower right-hand corner. This value is also determined when running the install or configure program. For more information see, the System Administrator Guide.
The logging system parameter FORCE_ABORT. When the Blocks in use field exceeds this value, the oldest transaction is aborted. To find out which transaction is being aborted, use the Log Transaction Display screen. Also, see Logging System Header Screen with Transaction Display. Tab to the Status column and select the Find menu item to look for the word FORCE. A warning indicator is also displayed. For more information, see the System Administrator Guide.
A consistency point occurs when the log file size (Blocks in use field) reaches a multiple of this number.
The number of blocks in use in the log file. This is determined by the Begin (BOF) and End (EOF) values. This value is used for the Log file in use diagram.
The number of remaining blocks in the log file
The number of blocks set aside to write compensation records in the event that transactions need to rollback.
The logical beginning of file. This is the position in the log file that holds the oldest transaction.
The logical end of file. This is the position in the log file that holds the newest uncommitted transaction.
The log file address of the last consistency point. This is the position in the log file where the last consistency point was taken.
The log file address of the next expected consistency point
The status of the logging and recovery systems. For a list of valid status fields, see Logging System Header Screen Status Field Values.
Depicts a logical view of the log file with the left side of the field representing page 1 and the right side representing Block count pages (for example, 1024 pages). Within this field an arrow diagram (">------>") represents the portion of the log file in use. If the portion of the log file in use spans only one position in the field, an "*" is displayed. As the EOF and BOF change, the arrow moves from left to right and wrap around the diagram.
The percentage of the log file in use. This is determined by the Begin (BOF) and End (EOF) values.
|
|
|
The Status field on the Logging System Header screen can have the following values:
The archiver is preparing to shut down. (This indicates that an rcpconfig command with the shutdown option has been issued.)
The archiver process is archiving journaled transactions to the journal files.
The logging system is requesting the recovery process to start writing a begin consistency point.
The logging system marks the start of on-line backup. It marks this block as the on-line backup start block (SB). Ckpdb starts backing up the database.
The logging system is in the process of closing a database.
DBMS servers are flushing their modified pages to disk.
The logging system is about to take a consistency point.
The logging system is synchronizing the fast-commit threads.
The logging system is in the process of disabling dual logging.
Dual logging is enabled.
Note: DUAL_LOGGING does not mean that both primary and dual logs are active. To determine this, check for Active Log(s).)
The logging system is requesting that the recovery process start writing an end consistency point.
The logging system has taken an end consistency point. This status flag is present most of the time while the logging system is functioning normally.
The force-abort-limit has been reached; the logging system is aborting the oldest transaction. The Log Transaction Display screen can be used to find out which transaction is being aborted.
The logging system has been told to shut down immediately. (This is displayed when the user invokes rcpconfig with the imm_shutdown option.) Note that the logging system does not perform any housekeeping as part of the shutdown process. The recovery process becomes responsible for backing out any uncommitted transactions left in the log file once the logging system has been restarted.
The log file is full. The system administrator must determine the cause of this and increase the log file size. A warning indicator is also displayed.
The logging system has been requested to manually abort a distributed transaction.
The logging system has been requested to manually commit a distributed transaction.
The logging system is on line. The logging and recovery systems are operating OK.
The logging system is in the process of opening a database.
A database has been closed by the last user who had it open; the archiver is archiving transactions that belong to this database.
The recovery process is recovering transactions from a runaway DBMS.
The logging system has requested the recovery process to perform recovery.
This is an important status that indicates that the archiver has stopped and must be restarted by the database administrator (DBA). This is not done automatically. If the archiver is not restarted, the log file eventually fills up, reaching the LOG_FILE_FULL limit, and causing Ingres to stall.
The logging system is shutting down. As part of the shutdown process, the logging system commits to disk all the committed transactions and backs out any uncommitted ones. The archiver also journals all the committed transactions for tables with journaling enabled.
|
|
|
The Logging System Header screen has the following menu items:
Displays additional information on the log file addresses.
For more information on this screen, see Logging System Header More_Info Screen.
Queries the logging system for logging system header information. Even if the autorefresh option is set, this menu item can be selected at any time.
Displays a submenu and additional screen display fields that allow examination of the transactions in the log file. For more information, see Logging System Header Screen with Transaction Display.
Displays help screens.
Returns to the Log Info Menu screen.
Exits IPM.
|
|
|
Selecting the More_Info menu item from the Logging System Header screen displays a pop-up screen, providing additional log address information.
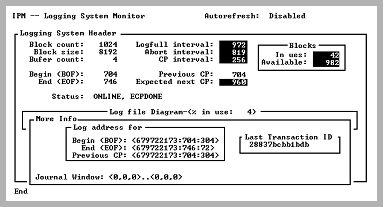
The pop-up has the following fields:
The log file address of the beginning of file
The log file address of the end of file
The log file address of the last consistency point
The last transaction ID used. This number corresponds to the External TX ID column on the Log Transaction Display screen and the Transaction ID column on the Lock List Display screen.
The log file address range where the archiver looks for records to journal
|
|
|
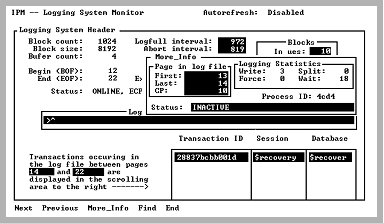
When you select the Examine menu item, the Logging System Header screen displays additional transaction information.
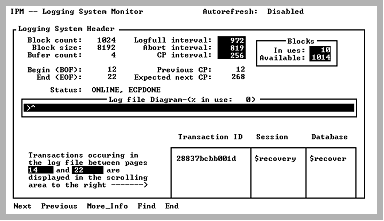
The Log file Diagram field is highlighted and a caret symbol ^ appears in that field marking the position of the log file currently being examined. Any transactions occurring in the range of pages covered by the caret (^) symbol are displayed in the scrolling area. The range of log file pages currently being examined is also displayed.
By using the Next and Previous menu items, you can move the caret symbol to any area of the Log file diagram covered by the arrow (">----->"). By default, when the Examine menu item is selected, the caret symbol appears at the BOF. The Next menu item can be selected until a user transaction appears in the scrolling area. This transaction is the oldest transaction in the log file and prevents log file space from being reclaimed.
|
|
|
From the Logging System Transaction Display, a position in the log file can be examined.
To examine a particular position in the log file
A snapshot is taken of the transactions, as well as the BOF and EOF. A pop-up screen displays the range of log file pages with transactions. The snapshot is used until the Examine submenu is exited.
To obtain the latest state of the logging system
Autorefresh, if enabled, is suspended during the Examine phase. Autorefresh is re-enabled when you exit the submenu.
|
|
|
After the Examine menu item is selected, a submenu appears. The menu items allow the caret symbol to be moved around on the diagram.
Note: Until you exit this submenu, the information being displayed is a snapshot.
The Transaction Display has the following menu items:
Moves the caret symbol to the right by one position. Moving beyond the EOF wraps around to the BOF. Any transactions occurring in the range covered by the next position are displayed in the scrolling area.
Moves the caret symbol to the left by one position. Moving below the BOF wraps around to the EOF. Any transactions occurring in the range covered by the previous position are displayed in the scrolling area.
Place the cursor on the transaction of interest (in the Transaction scrolling area) and select this menu item. Additional information for that transaction is displayed.
For more information on this screen, see More_Info Screen (Transaction Display).
Searches any column in the scrolling area. To initiate the search, tab to the desired column and select Find. If you are searching a text column, Find locates all occurrences in the column.
Returns to the Logging System Header screen main menu.
|
|
|
When you select the More_Info menu item from the Examine submenu, the Logging System Header screen displays a pop-up screen displaying additional transaction information.