This group of web pages provides you with information and statistics from the IPCop server. To get to these web pages, select from the tab bar at the top of the screen. The following choices will appear in a dropdown:
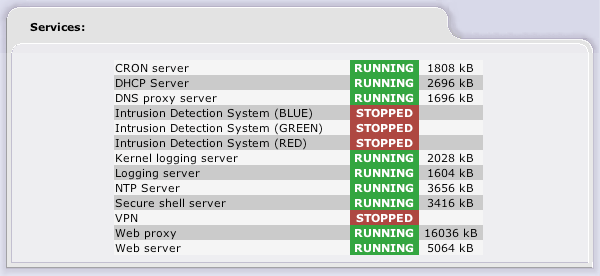
The Status pages present you with a VERY thorough list of information regarding the current status of your IPCop server. The first subsection, System Status, displays the following in top-down order:
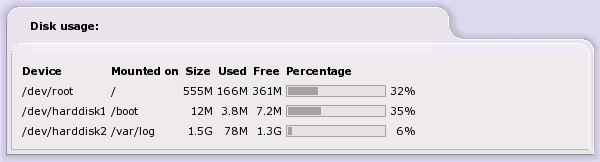
Disk Usage - Displays the total/used amount of hard drive space on your IPCop server.
Inodes Usage - This displays the total/used/free number of inodes on your IPCop server.
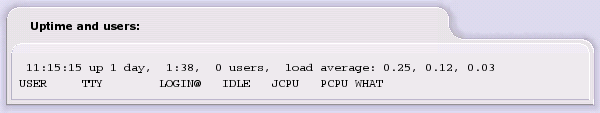
Uptime and Users - Displays the output of the uptime command and information on users currently logged in on the IPCop server.
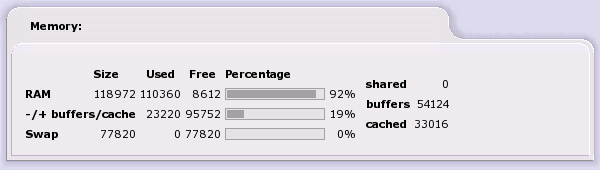
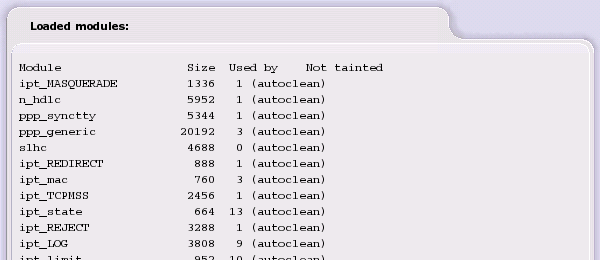
Loaded Modules - This displays all modules currently loaded and in use by the kernel.
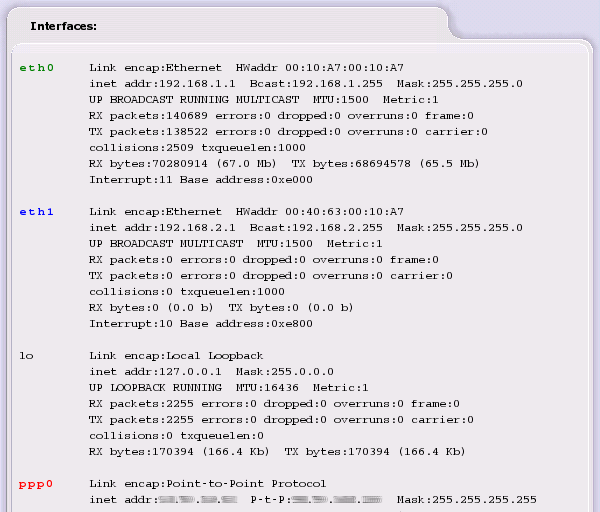
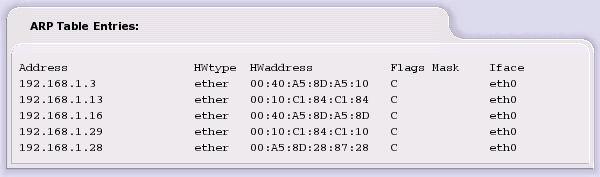
This section displays information on the network interfaces and networking within your IPCop server.
Interfaces - This section displays information on all your network devices. This includes PPP, IPSec, Loopback, etc.
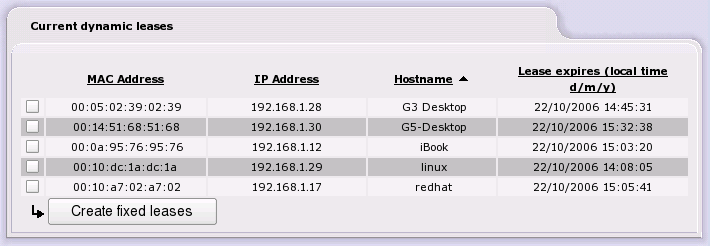
Displays the contents of the
/var/state/dhcp/dhcpd.leases
file if DHCP is enabled. The current dynamic leases are
listed, with hostnames if available, and expiry dates.
Leases that have expired are scored through.
Note
This section will only be visible if DHCP is enabled. Refer to the section on the DHCP Server for details.

Click on one of the four graphs (CPU Usage, Memory Usage, Swap Usage and Disk Access) to get graphs of the usage per Day, Week, Month and Year.
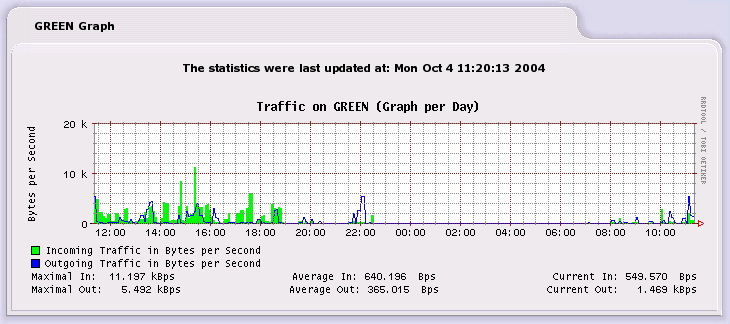
This page gives a graphic depiction of the traffic in and out of the IPCop box.
There are sections for each network interface, Green and Red, (and Blue and Orange if configured) which show graphs of incoming and outgoing traffic through that interface.
Click on one of the graphs to show more graphs of the traffic on that interface: per Day, Week, Month and Year.
Note
When v1.4.0 was being developed, it was found that the version of
rrdtool used to generate the graphs
was unable to handle special characters, which particularly
affects languages that rely on the UTF-8 character set.
The text on the graphs for those languages uses English.
Traffic graphs not working?
Graphs are generated by a script, run every five minutes by a cron job. If the graphs are unexpectedly empty, check that the time is correct, and check the System Logs>cron page to see if the makegraphs script is being run every five minutes. If not, try resetting fcron by logging in as “root” and executing the command “fcrontab -z”.
Or, manually run the makegraphs script to see if there are any useful error messages. Log in to a console as “root”, and execute the command “makegraphs”.
If there has been a big time shift in IPCop's onboard clock,
particularly backwards, the RRD (Round Robin Database) files may
complain about timing. In this case you may have to consider
deleting the database files, which can be found in the
/var/log/rrd directory. The database files
are recreated when the makegraphs script is next run, but any
prior data would be lost.
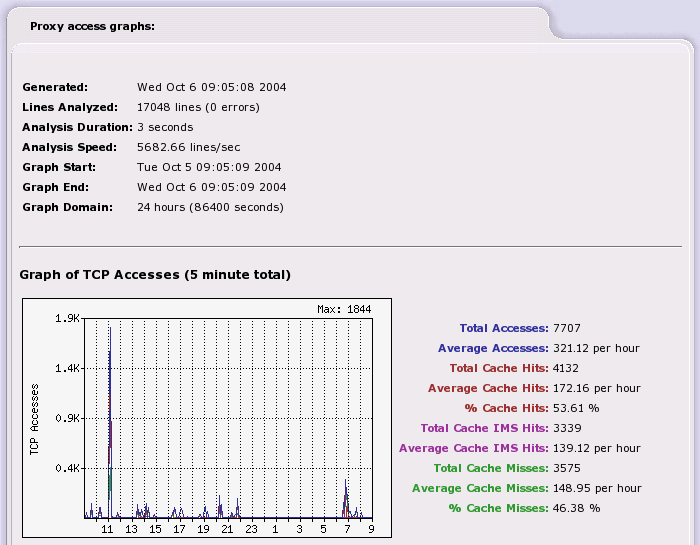
This page shows traffic through the proxy service of the IPCop box. The first section gives the date and time the graph was created, the lines analyzed, the duration of the analysis, the speed (lines per second), the start and end date and time of the graph, and the domain (overall length of the graph in time).
This information is useful in seeing whether the proxy is the correct size for the load being experienced.
Note
Logging has to be enabled on the Web Proxy admin page, otherwise the graphs will be empty.
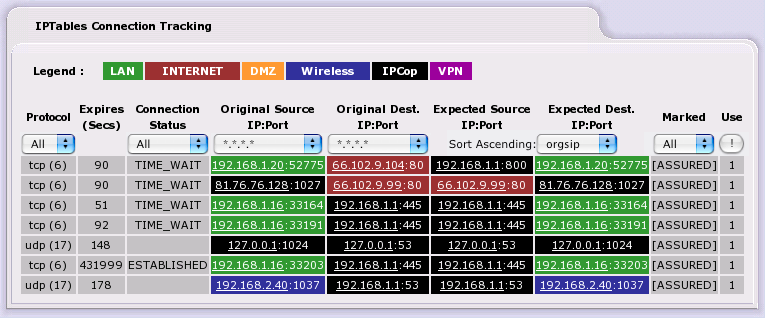
IPCop uses the Linux Netfilter or IPTables firewall facility to maintain a stateful firewall. Stateful firewalls keep track of connections to and from all GREEN, BLUE and ORANGE network IP addresses, based on both the source and destination IP addresses and ports, as well as the state of the connection itself. After a connection is established involving protected machines, only packets consistent with the current state of the connection are allowed through the IPCop firewall.
The IPTables Connection Tracking window shows the IPTables connections. Connection end points are color-coded based on their network location. The color-coding legend is displayed at the top of the page. Information on individual connections is displayed next. Each connection from or to your networks is shown.
Click on an IP Address to do a reverse DNS lookup.
The table can also be filtered and sorted by selecting options from the drop down menus, then pressing the button on the right to refresh the page.