| Home · Editor · Code Navigation · Shortcuts · Wiki |
[Previous: Development of Qt for Symbian Based Applications] [Qt Creator Manual] [Next: Qt Creator and Version Control Systems]
Qt Creator does not have its own debugger. Instead, it provides a graphical frontend to various debugger engines:
| Platform | Compiler | Debugger Engine |
|---|---|---|
| Linux, Unixes, Mac OS | gcc | GNU Symbolic Debugger (gdb) |
| Windows/MinGW | gcc | GNU Symbolic Debugger (gdb) |
| Windows | Microsoft Visual C++ Compiler | Debugging Tools for Windows/Microsoft Console Debugger (CDB) |
The frontend allows you to:
Qt Creator displays the raw information provided by the engine in a clear and concise manner. This simplifies the debugging process.
Qt Creator comes with generic IDE functionality: stack view, views for locals and watchers, registers, etc. In addition, Qt Creator includes features to make debugging Qt-based applications easy. The debugger frontend understands the internal layout of several Qt classes such as QString, the QTL containers, and most importantly QObject (and classes derived from it), as well as most containers of the C++ Standard Library. Therefore, the debugger can present their contents in a useful way.
| Debugger engine | Notes |
|---|---|
| Gdb | Requires gdb version 6.8. |
| Debugging tools for Windows | Using this engine requires you to install the Debugging tools for Windows 32-bit or 64-bit package (Version 6.11.1.404 for the 32-bit or the 64-bit version of Qt Creator, respectively), which is freely available for download from the Microsoft Developer Network. The pre-built Qt SDK for Windows makes use of the library if it is present on the system. When building Qt Creator using the Microsoft Visual C++ Compiler, the "%ProgramFiles%\Debugging Tools for Windows" path is checked to ensure that all required header files are there. |
In Debug mode, several dock widgets are used to interact with the program you are debugging. The frequently used dock widgets are visible by default; the rarely used ones are hidden. To change the default settings, select Debug and then select View.
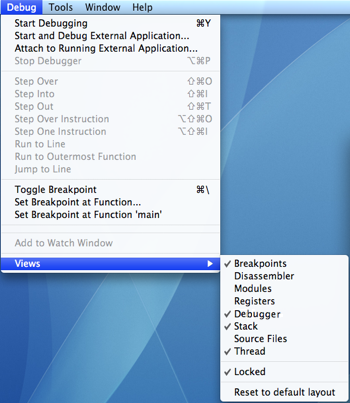
Here, you can lock or unlock the location of your views as well as display or hide them. Among the views you can display are Breakpoints, Stack, Thread, Modules, Registers, Disassembler, and Debugger. The position of your dock widgets is saved for future sessions.
To start a program under the debugger's control, select the Debug menu and Start Debugging, or press F5. Qt Creator checks whether the compiled program is up-to-date, rebuilding it if necessary. The debugger then takes over and starts the program.
Note: Starting a program in the debugger can take a considerable amount of time, typically in the range of several seconds to minutes if complex features (like QtWebKit) are used.
Once the program starts running, it behaves and performs as usual. The user can interrupt a running program by selecting Interrupt from the Debug menu. The program is automatically interrupted as soon as a breakpoint is hit.
Once the program stops, Qt Creator:
You can use the debugger views to examine the data in more detail.
To finish debugging, press Shift+F5. A line of code can be executed as a whole with F10; to step into a function or a sub-function, use F11. Alternatively, you can continue running the program with F5. It is also possible to continue executing the program until the current function completes or jump to an arbitrary position in the current function.
Breakpoints are shown in the Breakpoints view which is enabled by default. This view is also accessible when the debugger and the program being debugged is not running.
A breakpoint represents a position or sets of positions in the code that, when executed, interrupts the program being debugged and passes the control to the user. The user is then free to examine the state of the interrupted program, or continue execution either line-by-line or continuously.
Typically, breakpoints are associated with a source code file and line, or the start of a function -- both are allowed in Qt Creator.
Also, the interruption of a program by a breakpoint can be restricted with certain conditions.
You can set a breakpoint:
You can remove a breakpoint:
Breakpoints can be set and deleted before the program has actually started running or while it is running under the debugger's control. Also, breakpoints are saved together with a session.
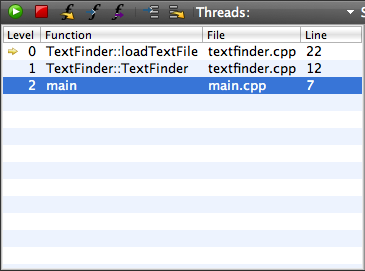
When the program being debugged is interrupted, Qt Creator displays the nested function calls leading to the current position as a call stack trace. This stack trace is built up from call stack frames, each representing a particular function. For each function, Qt Creator tries to retrieve the file name and line number of the corresponding source file. This data is shown in the Stack view.
Since the call stack leading to the current position may originate or go through code for which no debug information is available, not all stack frames have corresponding source locations. These frames are grayed out in the Stack view.
If you click on a frame with a known source location, the text editor jumps to the corresponding location and updates the Locals and Watchers view, making it seem like the program was interrupted before entering the function.
If a multi-threaded program is interrupted, the Thread view or the combobox named Thread in the debugger's status bar can be used to switch from one thread to another. The Stack view adjusts itself accordingly.
These views display the debugger's idea of the components of the application. By default, both views are hidden.
By default, both Disassembler and Registers view are hidden. The Disassembler view displays disassembled code for the current function; the Registers view displays the current state of the CPU's registers. Both views are useful for low-level commands such as Step Single Instruction and Step Over Single Instruction.
Whenever a program stops under the control of the debugger, it retrieves information about the topmost stack frame and displays it in the Locals and Watchers view. This typically includes information about parameters of the function in that frame as well as the local variables.
Compound variables of struct or class type are displayed as "expandable" in the view. Click on the "+" to expand the entry and show all members. Together with the display of value and type, the user can examine and traverse the low-level layout of an object's data.
| Note: |
| Gdb, and therefore Qt Creator's debugger works for optimized builds on Linux and Mac OS X. However, optimization may lead to re-ordering of instructions or sometimes even complete removal of some local variables. In this case, the Locals and Watchers view may show unexpected data. |
| The debug information provided by gcc does not include enough information about the time when a variable is initialized. Therefore, Qt Creator can not tell whether the contents of a local variable contains "real data", or "initial noise". If a QObject appears uninitialized, its value is reported as "out of scope". However, not all uninitialized objects can be recognized as such. |
The Locals and Watchers view also provides access to the most powerful feature of the debugger: comprehensive display of data belonging to Qt's basic objects. To enable this feature, select Use debugging helper from the Debug menu.The Locals and Watchers view is re-organized to provide a high-level view of the objects. For example, in case of QObject, instead of displaying a pointer to some private data structure, you see a list of children, signals and slots.
Similarly, instead of displaying many pointers and integers, Qt Creator's debugger displays the contents of a QHash or QMap in an orderly manner. Also, the debugger displays access data for QFileInfo and provides access to the "real" contents of QVariant.
The Locals and Watchers view can be used to change the contents of variables of simple data types such as int or float when the program is interrupted. To do so, click on the Value column, modify the value with the inplace editor, and hit Enter (or Return).
Note: The set of watched items is saved in your session.
While debugging, Qt Creator dynamically loads a helper library into your program. This helper library enables Qt Creator to pretty print Qt and STL types. The Qt SDK package already contains a prebuilt debugging helper library. To create an own debugging helper library, select Options from the Tools menu, and go to the Qt4 > Qt Versions pane. As the internal data structures of Qt can change between versions, the debugging helper library is built for each Qt version.
In our TextFinder example, we read a text file into QString and then display it with QTextEdit. Suppose you want to look at this QString, line, and see what data it actually stores. Follow the steps described below to place a breakpoint and view the QString object's data.
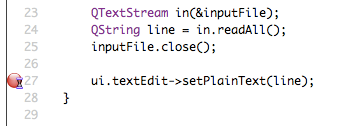 | Setting a Breakpoint
|
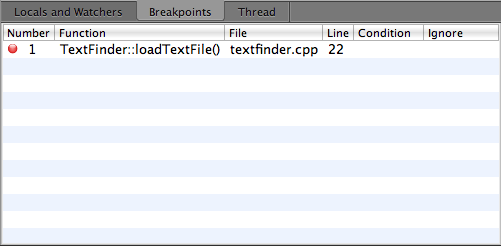 | Viewing and removing breakpoints Breakpoints are visible in the Breakpoints view in Debug mode. To remove a breakpoint, right-click on it and select Delete breakpoint from the context menu. |
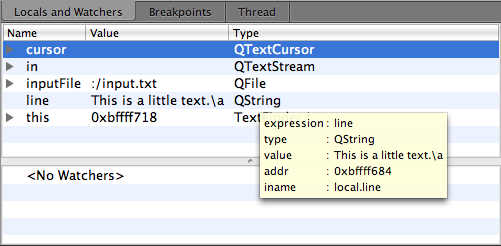 | Viewing Locals and Watchers To view the contents of line, go to the Locals and Watchers view. |
Suppose we modify our on_findButton_clicked() function to move back to the start of the document and continue searching once the cursor hits the end of the document. Adding this functionality can be done with the code snippet below:
    void TextFinder::on_findButton_clicked()
    {
        QString searchString = ui->lineEdit->text();

        QTextDocument *document = ui->textEdit->document();
        QTextCursor cursor = ui->textEdit->textCursor();
        cursor = document->find(searchString, cursor,
            QTextDocument::FindWholeWords);
        ui->textEdit->setTextCursor(cursor);

        bool found = cursor.isNull();

        if (!found && previouslyFound) {
            int ret = QMessageBox::question(this, tr("End of Document"),
            tr("I have reached the end of the document. Would you like "
            "me to start searching from the beginning of the document?"),
            QMessageBox::Yes | QMessageBox::No, QMessageBox::Yes);

            if (ret == QMessageBox::Yes) {
                cursor = document->find(searchString,
                    QTextDocument::FindWholeWords);
                ui->textEdit->setTextCursor(cursor);
            } else
                return;
        }
        previouslyFound = found;
    }
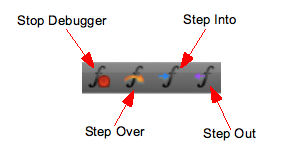
However, if you compile and run this code, the application does not work correctly due to a logic error. To locate this logic error, step through the code using the following buttons:
[Previous: Development of Qt for Symbian Based Applications] [Qt Creator Manual] [Next: Qt Creator and Version Control Systems]
| Copyright © 2009 Nokia Corporation and/or its subsidiary(-ies) | Trademarks | Qt Creator 1.3.0 |