Deploying a Jupyter Notebook project
This tutorial uses the sample project, Markowitz Notebook, included with Anaconda Enterprise. This project is an investment portfolio analysis that demonstrates a Jupyter Notebook running both R language and Python.
The notebook also demonstrates the pandas and Bokeh packages for analysis and visualization. It outputs four different interactive graphs. A step-by-step description of the analysis is available inside the notebook.
To copy the sample project into your list of projects, follow the
instructions on
viewing and saving sample projects
to get a copy of markowitz_notebook.
To deploy the Markowitz Notebook, follow the deployment instructions.
After your project has deployed, you can select it and see the running application - in this case a notebook.
A deployed notebook can be run and interacted with, but viewers cannot edit.
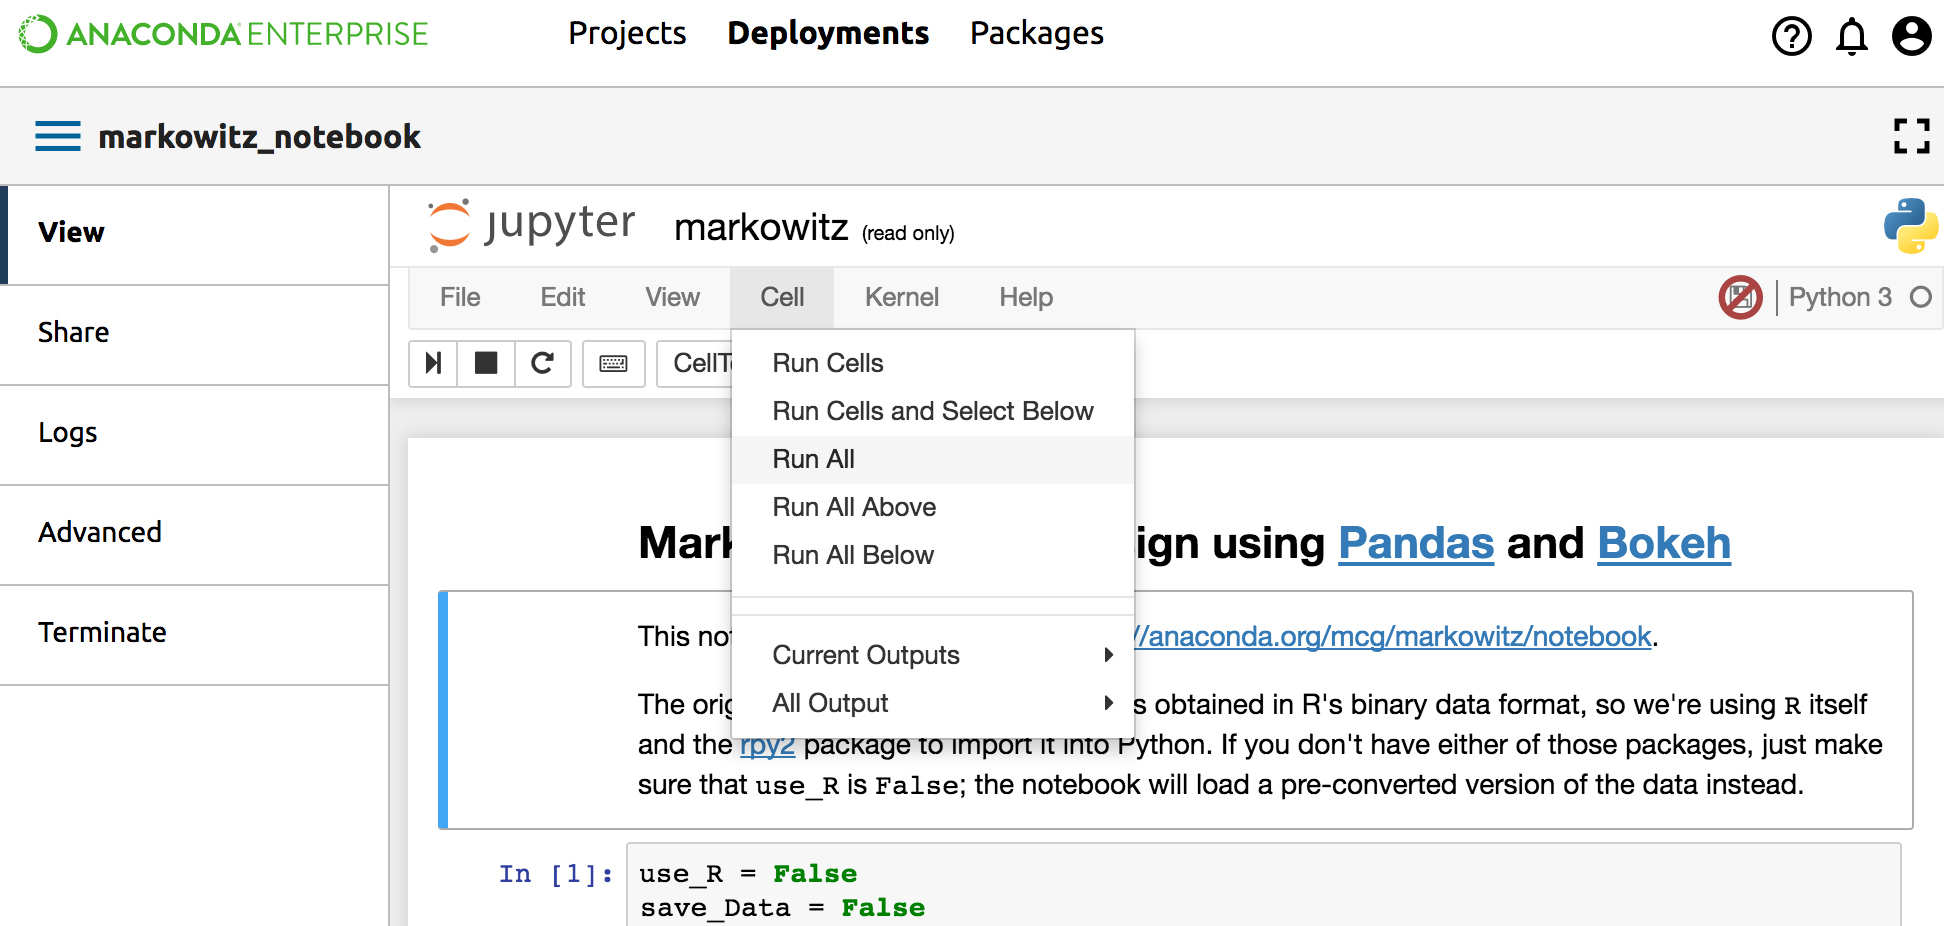
In the Jupyter Notebook top navigation bar, in the Cell menu, select Run All to run all of the included code blocks and generate the output:
Scroll down to see the generated plots and graphs:
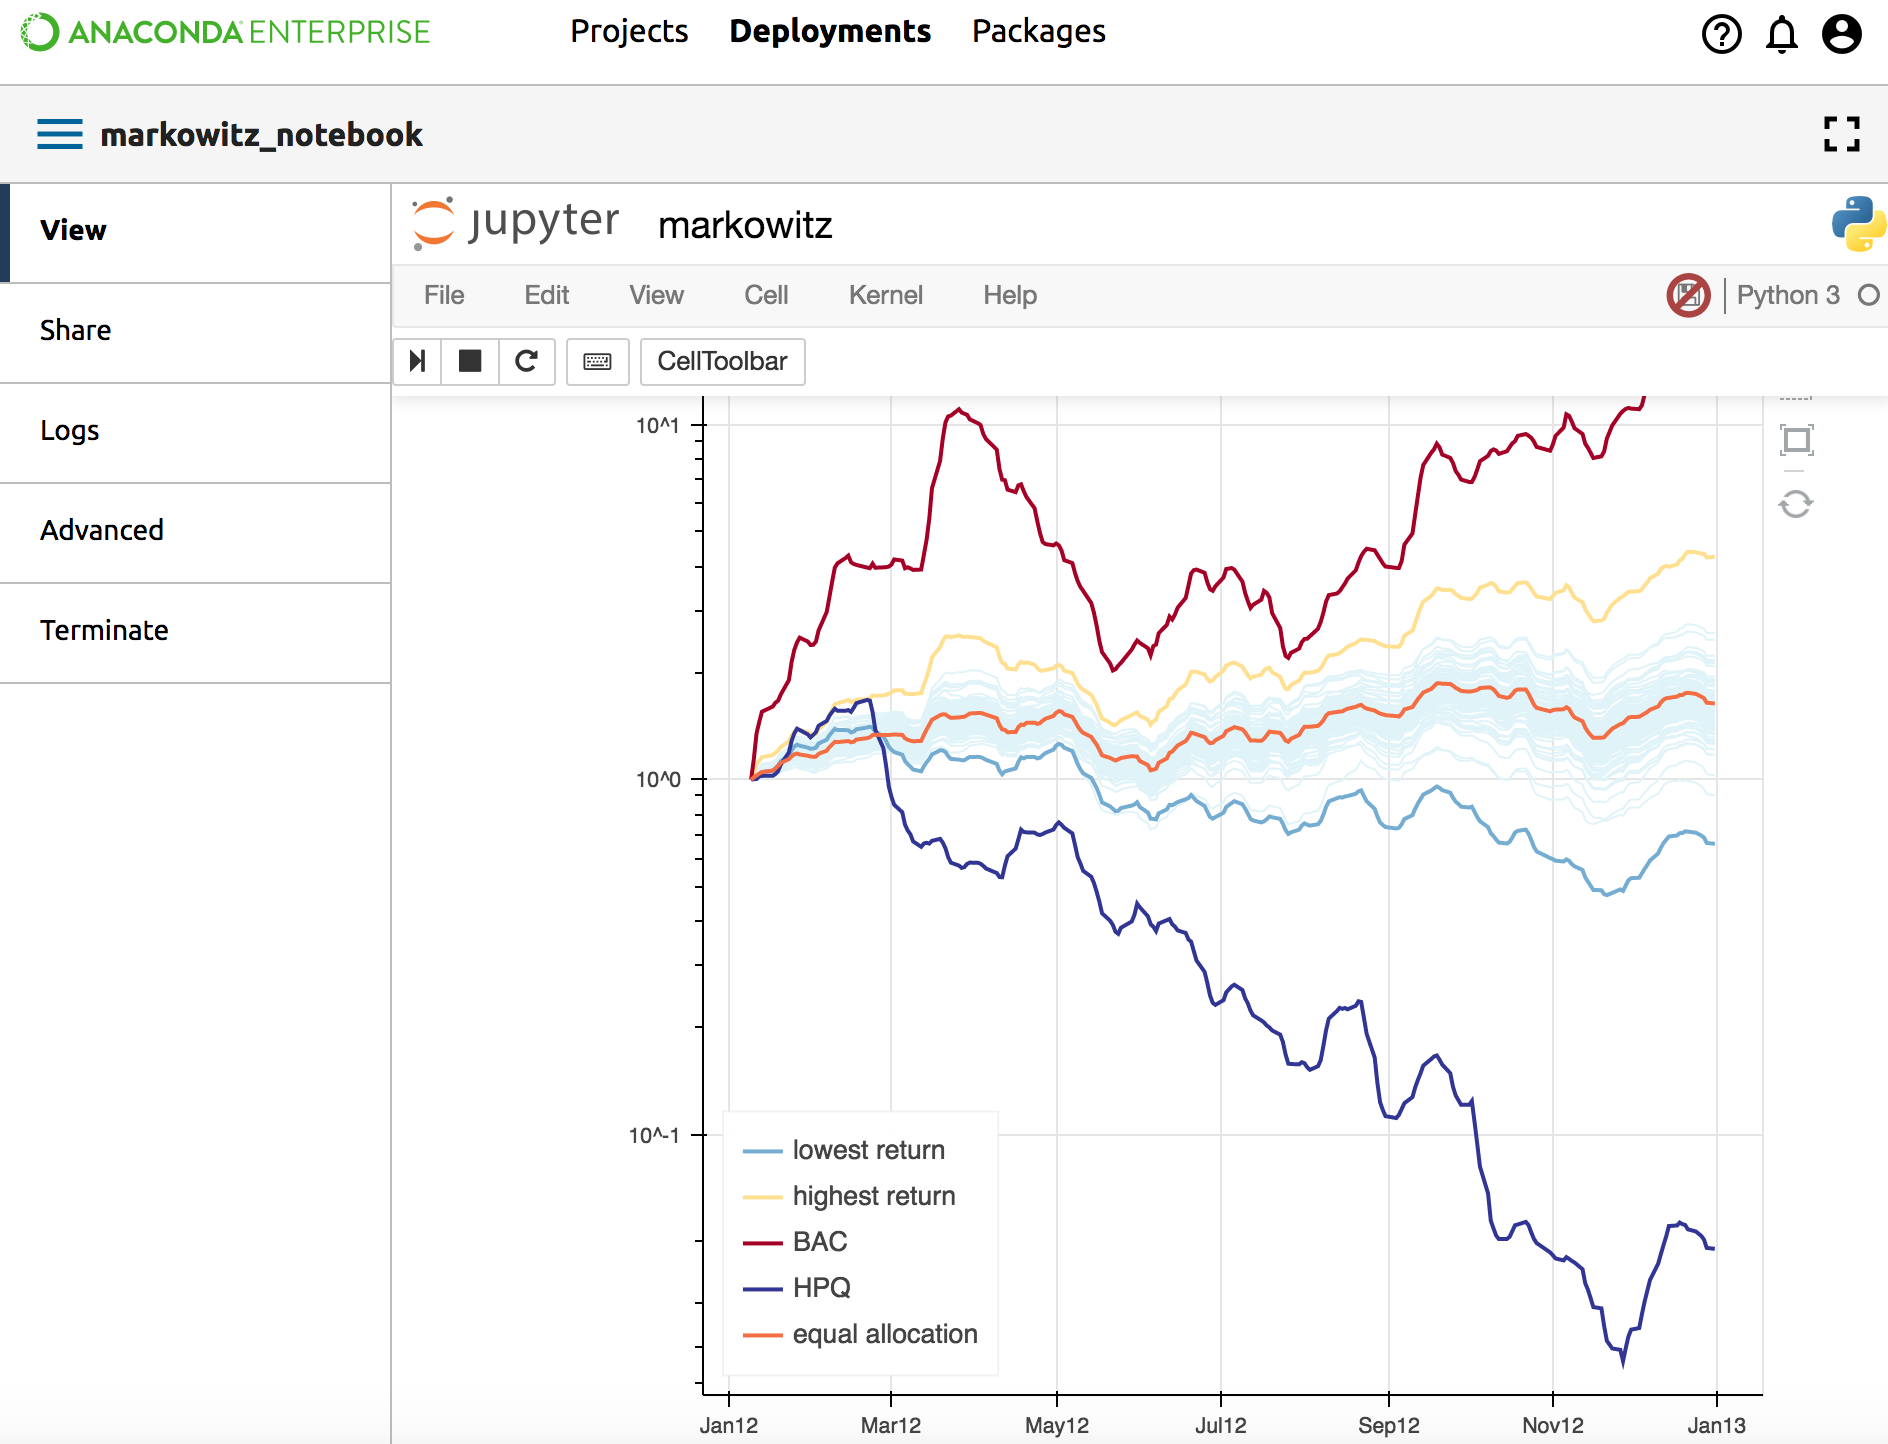
Interact with the deployment to change the data being sampled. Interactive selections in this notebook include pan, box zoom, resize and reset. The plots and graphs immediately adjust as you interact with them.