- Overview
- Common Operations
- Diagnostic Tools
- Troubleshooting
Overview
Components
The following components work together to deploy and maintain the service.
-
Mesos
Mesos is the foundation of the DC/OS cluster. Everything launched within the cluster is allocated resources and managed by Mesos. A typical Mesos cluster has one or three Masters that manage resources for the entire cluster. On DC/OS, the machines running the Mesos Masters will typically run other cluster services as well, such as Marathon and Cosmos, as local system processes. Separately from the Master machines are the Agent machines, which are where in-cluster processes are run. For more information on Mesos architecture, see the Apache Mesos documentation. For more information on DC/OS architecture, see the DC/OS architecture documentation.
-
ZooKeeper
ZooKeeper is a common foundation for DC/OS system components, like Marathon and Mesos. It provides distributed key-value storage for configuration, synchronization, name registration, and cluster state storage. DC/OS comes with ZooKeeper installed by default, typically with one instance per DC/OS master.
SDK Schedulers use the default ZooKeeper instance to store persistent state across restarts (under znodes named
dcos-service-<svcname>). This allows Schedulers to be killed at any time and continue where they left off.Note: SDK Schedulers currently require ZooKeeper, but any persistent configuration storage (such as etcd) could fit this role. ZooKeeper is a convenient default because it is always present in DC/OS clusters.
-
Marathon
Marathon is the “init system” of a DC/OS cluster. Marathon launches tasks in the cluster and keeps them running. From the perspective of Mesos, Marathon is itself another Scheduler running its own tasks. Marathon is more general than SDK Schedulers and mainly focuses on tasks that don’t require managing local persistent state. SDK services rely on Marathon to run the Scheduler and to provide it with a configuration via environment variables. The Scheduler, however, maintains its own service tasks without any direct involvement by Marathon.
-
Scheduler
The Scheduler is the “management layer” of the service. It launches the service nodes and keeps them running. It also exposes endpoints to allow end users to control the service and diagnose problems. The Scheduler is kept online by the cluster’s “init system”, Marathon. The Scheduler itself is effectively a Java application that is configured via environment variables provided by Marathon.
-
Packaging
SDK services are packaged for deployment on DC/OS. DC/OS packages follow the Universe schema, which defines how packages expose customization options at initial installation. When a package is installed on the cluster, the packaging service (named ‘Cosmos’) creates a Marathon app that contains a rendered version of the
marathon.json.mustachetemplate provided by the package. For an SDK service, this Marathon app is the Scheduler for the service.
For further discussion of DC/OS components, see the architecture documentation.
Deployment
Internally, the SDK treats “Deployment” as moving from one state to another state. By this definition, “Deployment” applies to many scenarios:
- When a service is first installed, deployment is moving from a null configuration to a deployed configuration.
- When the deployed configuration is changed by editing an environment variable in the Scheduler, deployment is moving from an initial running configuration to a new proposed configuration.
In this section, we’ll describe how these scenarios are handled by the Scheduler.
Initial Install
This is the flow for deploying a new service:
Steps handled by the DC/OS cluster
-
The user runs
dcos package install <package-name>in the DC/OS CLI or clicksInstallfor a given package on the DC/OS Dashboard. -
A request is sent to the Cosmos packaging service to deploy the requested package along with a set of configuration options.
-
Cosmos creates a Marathon app definition by rendering the package’s
marathon.json.mustachewith the configuration options provided in the request. In the case of an SDK service, this app represents the service’s Scheduler. Cosmos queries Marathon to create the app. -
Marathon launches the service’s Scheduler somewhere in the cluster using the rendered app definition provided by Cosmos.
-
The service Scheduler is launched. From this point onwards, the SDK handles deployment.
Steps handled by the Scheduler
The service Scheduler’s main() function is run like any other Java application. The Scheduler starts with the following state:
- A
svc.ymltemplate that represents the service configuration. - Environment variables provided by Marathon, to be applied onto the
svc.ymltemplate. - Any custom logic implemented by the service developer in their Main function (we’ll be assuming this is left with defaults for the purposes of this explanation).
-
The
svc.ymltemplate is rendered using the environment variables provided by Marathon. -
The rendered
svc.yml“Service Spec” contains the host/port for the ZooKeeper instance, which the Scheduler uses for persistent configuration/state storage. The default ismaster.mesos:2181, but may be manually configured to use a different ZooKeeper instance. The Scheduler always stores its information under a znode nameddcos-service-<svcname>. -
The Scheduler connects to that ZooKeeper instance and checks to see if it has previously stored a Mesos Framework ID for itself.
-
If the Framework ID is present, the Scheduler will attempt to reconnect to Mesos using that ID. This may result in a “Framework has been removed” error if Mesos doesn’t recognize that Framework ID, indicating an incomplete uninstall.
-
If the Framework ID is not present, the Scheduler will attempt to register with Mesos as a Framework. Assuming this is successful, the resulting Framework ID is then immediately stored.
-
Now that the Scheduler has registered as a Mesos Framework, it is able to start interacting with Mesos and receiving offers. When this begins, Schedulers using the SDK will begin running the Offer Cycle and deploying the service. See that section for more information.
-
The Scheduler retrieves its deployed task state from ZooKeeper and finds that there are tasks that should be launched. This is the first launch, so all tasks need to be launched.
-
The Scheduler deploys those missing tasks through the Mesos offer cycle using a Deployment Plan to determine the ordering of that deployment.
-
Once the Scheduler has launched the missing tasks, its current configuration should match the desired configuration defined by the “Service Spec” extracted from
svc.yml.- When the current configuration matches the desired configuration, the Scheduler will tell Mesos to suspend sending new offers, as there’s nothing to be done.
- The Scheduler idles until it receives an RPC from Mesos notifying it of a task status change, it receives an RPC from an end user against one of its HTTP APIs, or until it is killed by Marathon as the result of a configuration change.
Reconfiguration
This is the flow for reconfiguring a DC/OS service either in order to update specific configuration values, or to upgrade it to a new package version.
Steps handled by the DC/OS cluster
- The user edits the Scheduler’s environment variables either using the Scheduler CLI’s
updatecommand or via the DC/OS GUI. - The DC/OS package manager instructs Marathon to kill the current Scheduler and launch a new Scheduler with the updated environment variables.
Steps handled by the Scheduler
As with initial install above, at this point the Scheduler is re-launched with the same three sources of information it had before:
-
svc.ymltemplate. - New environment variables.
- Custom logic implemented by the service developer (if any).
In addition, the Scheduler now has a fourth piece:
- Preexisting state in ZooKeeper
Scheduler reconfiguration is slightly different from initial deployment because the Scheduler is now comparing its current state to a non-empty prior state and determining what needs to be changed.
- After the Scheduler has rendered its
svc.ymlagainst the new environment variables, it has two Service Specs, reflecting two different configurations.- The Service Spec that was just rendered, reflecting the configuration change.
- The prior Service Spec (or “Target Configuration”) that was previously stored in ZooKeeper.
- The Scheduler automatically compares the changes between the old and new Service Specs.
-
Change validation: Certain changes, such as editing volumes and scale-down, are not currently supported because they are complicated and dangerous to get wrong.
- If an invalid change is detected, the Scheduler will send an error message and refuse to proceed until the user has reverted the change by relaunching the Scheduler app in Marathon with the prior config.
- If the changes are valid, the new configuration is stored in ZooKeeper as the new Target Configuration and the change deployment proceeds as described below.
-
Change deployment: The Scheduler produces a
diffbetween the current state and some future state, including all of the Mesos calls (reserve, unreserve, launch, destroy, etc.) needed to get there. For example, if the number of tasks has been increased, then the Scheduler will launch the correct number of new tasks. If a task configuration setting has been changed, the Scheduler will deploy that change to the relevant affected tasks by relaunching them. Tasks that aren’t affected by the configuration change will be left as-is. -
Custom update logic: Some services may have defined a custom
updatePlan in itssvc.yml, in cases where different logic is needed for an update/upgrade than is needed for the initial deployment. When a customupdateplan is defined, the Scheduler will automatically use this Plan, instead of the defaultdeployPlan, when rolling out an update to the service.
-
Change validation: Certain changes, such as editing volumes and scale-down, are not currently supported because they are complicated and dangerous to get wrong.
Uninstall
This is the flow for uninstalling a DC/OS service.
Steps handled by the cluster
- The user uses the DC/OS CLI’s
dcos package uninstallcommand to uninstall the service. - The DC/OS package manager instructs Marathon to kill the current Scheduler and to launch a new Scheduler with the environment variable
SDK_UNINSTALLset to “true”.
Steps handled by the Scheduler
When started in uninstall mode, the Scheduler performs the following actions:
- Any Mesos resource reservations are unreserved.
- Warning: Any data stored in reserved disk resources will be irretrievably lost.
- Preexisting state in ZooKeeper is deleted.
Offer Cycle
The Offer Cycle is a core Mesos concept and often a source of confusion when running services on Mesos.
Mesos will periodically notify subscribed Schedulers of resources in the cluster. Schedulers are expected to either accept the offered resources or decline them. In this structure, Schedulers never have a complete picture of the cluster, they only know about what’s being explicitly offered to them at any given time. This allows Mesos the option of only advertising certain resources to specific Schedulers, without requiring any changes on the Scheduler’s end, but it also means that the Scheduler cannot deterministically know whether it’s seen everything that’s available in the cluster.
Schedulers written using the SDK perform the following operations as Offers are received from Mesos:
- Task Reconciliation: Mesos is the source of truth for what is running on the cluster. Task Reconciliation allows Mesos to convey the status of all tasks being managed by the service. The Scheduler will request a Task Reconciliation during initial startup, and Mesos will then send the current status of that Scheduler’s tasks. This allows the Scheduler to catch up with any potential status changes to its tasks that occurred after the Scheduler was last running. A common pattern in Mesos is to jealously guard most of what it knows about tasks, so this only contains status information, not general task information. The Scheduler keeps its own copy of what it knows about tasks in ZooKeeper. During an initial deployment this process is very fast as no tasks have been launched yet.
- Offer Acceptance: Once the Scheduler has finished Task Reconciliation, it will start evaluating the resource offers it receives to determine if any match the requirements of the next task(s) to be launched. At this point, users on small clusters may find that the Scheduler isn’t launching tasks. This is generally because the Scheduler isn’t able to find offered machines with enough room to fit the tasks. To fix this, add more/bigger machines to the cluster, or reduce the requirements of the service.
- Resource Cleanup: The Offers provided by Mesos include reservation information if those resources were previously reserved by the Scheduler. The Scheduler will automatically request that any unrecognized but reserved resources be automatically unreserved. This can come up in a few situations, for example, if an agent machine went away for several days and then came back, its resources may still be considered reserved by Mesos as reserved by the service, while the Scheduler has already moved on and doesn’t know about it anymore. At this point, the Scheduler will automatically clean up those resources.
SDK Schedulers will automatically notify Mesos to stop sending offers, or “suspend” offers, when the Scheduler doesn’t have any work to do. For example, once a service deployment has completed, the Scheduler will request that offers be suspended. If the Scheduler is later notified that a task has exited via a status update, the Scheduler will resume offers in order to redeploy that task back where it was. This is done by waiting for the offer that matches that task’s reservation, and then launching the task against those resources once more.
Pods
A Task generally maps to a single process within the service. A Pod is a collection of colocated Tasks that share an environment. All Tasks in a Pod will come up and go down together. Therefore, most maintenance operations against the service are at Pod granularity rather than Task granularity.
Plans
The Scheduler organizes its work into a list of Plans. Every SDK Scheduler has at least a Deployment Plan and a Recovery Plan, but other Plans may also be added for things like custom Backup and Restore operations. The Deployment Plan is in charge of performing an initial deployment of the service. It is also used for rolling out configuration changes to the service (or in more abstract terms, handling the transition needed to get the service from some state to another state), unless the service developer provided a custom update Plan. The Recovery Plan is in charge of relaunching any exited tasks that should always be running.
Plans have a fixed three-level hierarchy. Plans contain Phases, and Phases contain Steps.
For example, let’s imagine a service with two index nodes and three data nodes. The Plan structure for a Scheduler in this configuration could look like this:
- Deployment Plan (
deploy)- Index Node Phase
- Index Node 0 Step
- Index Node 1 Step
- Data Node Phase
- Data Node 0 Step
- Data Node 1 Step
- Data Node 2 Step
- Index Node Phase
- Custom Update Plan (
update)- (custom logic, if any, for rolling out a config update or software upgrade)
- Recovery Plan (
recovery)- (phases and steps are autogenerated as failures occur)
- Index Backup Plan
- Run Reindex Phase
- Index Node 0 Step
- Index Node 1 Step
- Upload Data Phase
- Index Node 0 Step
- Index Node 1 Step
- Run Reindex Phase
- Data Backup Plan
- Data Backup Phase
- Data Node 0 Step
- Data Node 1 Step
- Data Node 2 Step
- Data Backup Phase
As you can see, in addition to the default Deployment and Recovery Plans, this Scheduler also has a custom Update Plan which provides custom logic for rolling out a change to the service. If a custom plan is not defined then the Deployment Plan is used for this scenario. In addition, the service defines auxiliary Plans that support other custom behavior, specifically one Plan that handles backing up Index nodes, and another for that backs up Data nodes. In practice, there would likely also be Plans for restoring these backups. These auxiliary Plans could all be invoked manually by an operator, and may include additional parameters such as credentials or a backup location. Those are omitted here for brevity.
In short, Plans are the SDK’s abstraction for a sequence of tasks to be performed by the Scheduler. By default, these include deploying and maintaining the cluster, but additional maintenance operations may also be fit into this structure.
Custom Update Plan
By default, the service will use the Deployment Plan when rolling out a configuration change or software upgrade, but some services may need custom logic in this scenario, in which case the service developer may have defined a custom plan named update.
Recovery Plan
The other default Plan is the Recovery Plan, which handles bringing back failed tasks. The Recovery Plan listens for offers that can be used to bring back those tasks and then relaunches tasks against those offers.
The Scheduler learns whether a task has failed by receiving Task Status updates from Mesos. Task Status updates can be sent during startup to let the scheduler know when a task has started running, to know when the task has exited successfully, or to know when the cluster has lost contact with the machine hosting that task.
When it receives a Task Status update, the Scheduler decides whether a given update indicates a task that needs to be relaunched. When a task must be relaunched, the Scheduler will wait on the Offer cycle.
Permanent and temporary recovery
There are two types of recovery, permanent and temporary. The difference is mainly whether the task being recovered should stay on the same machine, and the side effects that result from that.
-
Temporary recovery:
- Temporary recovery is triggered when there is a hiccup in the task or the host machine.
- Recovery involves relaunching the task on the same machine as before.
- Recovery occurs automatically.
- Any data in the task’s persistent volumes survives the outage.
- May be manually triggered by a
pod restartcommand.
-
Permanent recovery:
- Permanent recovery can be requested when the host machine fails permanently or when the host machine is scheduled for downtime.
- Recovery involves discarding any persistent volumes that the pod once had on the host machine.
- Recovery only occurs in response to a manual
pod replacecommand (or operators may build their own tooling to invoke the replace command).
Triggering a permanent recovery is a destructive operation, as it discards any prior persistent volumes for the pod being recovered. This is desirable when the operator knows that the previous machine isn’t coming back. For safety’s sake, permanent recovery is currently not automatically triggered by the SDK itself.
Persistent Volumes
The SDK was created to help simplify the complexity of dealing with persistent volumes. SDK services currently treat volumes as tied to specific agent machines, as one might have in a datacenter with local drives in each system. While EBS or SAN volumes, for instance, can be re-mounted and reused across machines, this isn’t yet supported in the SDK.
Volumes are advertised as resources by Mesos, and Mesos offers multiple types of persistent volumes. The SDK supports two of these types: MOUNT volumes and ROOT volumes.
-
ROOT volumes:
- Use a shared filesystem tree.
- Share I/O with anything else on that filesystem.
- Are supported by default in new deployments and do not require additional cluster-level configuration.
- Are allocated exactly the amount of disk space that was requested.
-
MOUNT volumes:
- Use a dedicated partition.
- Have dedicated I/O for the partition.
- Require additional configuration when setting up the DC/OS cluster.
- Are allocated the entire partition, so allocated space can far exceed what was originally requested. MOUNT volumes cannot be further subdivided between services.
The fact that MOUNT volumes cannot be subdivided between services means that if multiple services are deployed with MOUNT volumes, they can quickly be unable to densely colocate within the cluster unless many MOUNT volumes are created on each agent. Let’s look at the following deployment scenario across three DC/OS agent machines, each with two enabled MOUNT volumes labeled A and B:
Agent 1: A B
Agent 2: A B
Agent 3: A B
Now we install a service X with two nodes that each use one mount volume. The service consumes volume A on agents 1 and 3:
Agent 1: X B
Agent 2: A B
Agent 3: X B
Now a service Y is installed with two nodes that each use two mount volumes. The service consumes volume A and B on agent 2, but then is stuck without being able to deploy anything else:
Agent 1: X B
Agent 2: Y Y
Agent 3: X B
Configuring ROOT vs MOUNT volumes may depend on the service. Some services will support customizing this setting when it is relevant, while others may assume one or the other.
Virtual networks
The SDK allows pods to join virtual networks, with the dcos virtual network available by defualt. You can specify that a pod should join the virtual network by using the networks keyword in your YAML definition. Refer to Developers Guide for more information about how to define virtual networks in your service.
When a pod is on a virtual network such as the dcos:
- Every pod gets its own IP address and its own array of ports.
- Pods do not use the ports on the host machine.
- Pod IP addresses can be resolved with the DNS:
<task_name>.<service_name>.autoip.dcos.thisdcos.directory. - You can also pass labels while invoking CNI plugins. Refer to Developers Guide for more information about adding CNI labels.
Secrets
Enterprise DC/OS provides a secrets store to enable access to sensitive data such as database passwords, private keys, and API tokens. DC/OS manages secure transportation of secret data, access control and authorization, and secure storage of secret content.
The content of a secret is copied and made available within the pod. The SDK allows secrets to be exposed to pods as a file and/or as an environment variable. Refer to Developer Guide for more information about how DC/OS secrets are integration in SDK-based services. If the content of the secret is changed, the relevant pod needs to be restarted so that it can get updated content from the secret store.
Note: Secrets are available only in Enterprise DC/OS 1.10 onwards. Learn more about the secrets store.
Authorization for Secrets
The path of a secret defines which service IDs can have access to it. You can think of secret paths as namespaces. Only services that are under the same namespace can read the content of the secret.
| Secret | Service ID | Can service access secret? |
|---|---|---|
Secret_Path1 |
/user |
Yes |
Secret_Path1 |
/dev1/user |
Yes |
secret-svc/Secret_Path1 |
/user |
No |
secret-svc/Secret_Path1 |
/user/dev1 |
No |
secret-svc/Secret_Path1 |
/secret-svc |
Yes |
secret-svc/Secret_Path1 |
/secret-svc/dev1 |
Yes |
secret-svc/Secret_Path1 |
/secret-svc/instance2/dev2 |
Yes |
secret-svc/Secret_Path1 |
/secret-svc/a/b/c/dev3 |
Yes |
secret-svc/instance1/Secret_Path2 |
/secret-svc/dev1 |
No |
secret-svc/instance1/Secret_Path2 |
/secret-svc/instance2/dev3 |
No |
secret-svc/instance1/Secret_Path2 |
/secret-svc/instance1 |
Yes |
secret-svc/instance1/Secret_Path2 |
/secret-svc/instance1/dev3 |
Yes |
secret-svc/instance1/Secret_Path2 |
/secret-svc/instance1/someDir/dev3 |
Yes |
Note: Absolute paths (paths with a leading slash) to secrets are not supported. The file path for a secret must be relative to the sandbox.
Binary Secrets
You can store binary files, like a Kerberos keytab, in the DC/OS secrets store. Your file must be Base64-encoded as specified in RFC 4648.
You can use standard base64 command line utility. The following example uses the BSD base64 command.
$ base64 -i krb5.keytab -o kerb5.keytab.base64-encoded
The base64 command line utility in Linux inserts line-feeds in the encoded data by default. Disable line-wrapping with the -w 0 argument. Here is a sample base64 command in Linux.
$ base64 -w 0 -i krb5.keytab > kerb5.keytab.base64-encoded
Prefix the secret name with __dcos_base64__. For example some/path/__dcos_base64__mysecret and __dcos_base64__mysecret will be base64-decoded automatically.
$ dcos security secrets create -f kerb5.keytab.base64-encoded some/path/__dcos_base64__mysecret
When you reference the __dcos_base64__mysecret secret in your service, the content of the secret will be first base64-decoded, and then copied and made available to your service. Refer to the Developer Guide for more information on how to reference DC/OS secrets as a file in SDK-based services. Refer to a binary secret
only as a file such that it will be autoatically decoded and made available as a temporary in-memory file mounted within your container (file-based secrets).
Placement Constraints
Placement constraints allow you to customize where a service is deployed in the DC/OS cluster. Depending on the service, some or all components may be configurable using Marathon operators (reference) with this syntax: field:OPERATOR[:parameter]. For example, if the reference lists [["hostname", "UNIQUE"]], you should use hostname:UNIQUE.
A common task is to specify a list of whitelisted systems to deploy to. To achieve this, use the following syntax for the placement constraint:
hostname:LIKE:10.0.0.159|10.0.1.202|10.0.3.3
You must include spare capacity in this list, so that if one of the whitelisted systems goes down, there is still enough room to repair your service (via pod replace) without requiring that system.
Regions and Zones
Placement constraints can be applied to zones by referring to the @zone key. For example, one could spread pods across a minimum of 3 different zones by specifying the constraint:
[["@zone", "GROUP_BY", "3"]]
When the region awareness feature is enabled (currently in beta), the @region key can also be referenced for defining placement constraints. Any placement constraints that do not reference the @region key are constrained to the local region.
Updating placement constraints
Clusters change, and as such so should your placement constraints. We recommend using the following procedure to do this:
- Update the placement constraint definition at the Scheduler.
- For each pod, one at a time, perform a
pod replacefor any pods that need to be moved to reflect the change.
For example, let’s say we have the following deployment of our imaginary data nodes, with manual IPs defined for placing the nodes in the cluster:
- Placement constraint of:
hostname:LIKE:10.0.10.3|10.0.10.8|10.0.10.26|10.0.10.28|10.0.10.84 - Tasks:
10.0.10.3: data-0
10.0.10.8: data-1
10.0.10.26: data-2
10.0.10.28: [empty]
10.0.10.84: [empty]
Given the above configuration, let’s assume 10.0.10.8 is being decommissioned and our service should be moved off of it. Steps:
- Remove the decommissioned IP and add a new IP to the placement rule whitelist, by configuring the Scheduler environment with a new
DATA_NODE_PLACEMENTsetting:hostname:LIKE:10.0.10.3|10.0.10.26|10.0.10.28|10.0.10.84|10.0.10.123 - Wait for the Scheduler to restart with the new placement constraint setting.
- Trigger a redeployment of
data-1from the decommissioned node to a new machine within the new whitelist:dcos myservice node replace data-1 - Wait for
data-1to be up and healthy before continuing with any other replacement operations.
The ability to configure placement constraints is defined on a per-service basis. Some services may offer very granular settings, while others may not offer them at all. You’ll need to consult the documentation for the service in question, but in theory they should all understand the same set of Marathon operators.
Integration with DC/OS access controls
In DC/OS 1.10 and above, you can integrate your SDK-based service with DC/OS ACLs to grant users and groups access to only certain services. You do this by installing your service into a folder, and then restricting access to some number of folders. Folders also allow you to namespace services. For instance, staging/kafka and production/kafka.
Steps:
- In the DC/OS GUI, create a group, then add a user to the group. Or, just create a user. Click Organization > Groups > + or Organization > Users > +. If you create a group, you must also create a user and add them to the group.
-
Give the user permissions for the folder where you will install your service. In this example, we are creating a user called
developer, who will have access to the/testingfolder. Select the group or user you created. Select ADD PERMISSION and then toggle to INSERT PERMISSION STRING. Add each of the following permissions to your user or group, and then click ADD PERMISSIONS.dcos:adminrouter:service:marathon full dcos:service:marathon:marathon:services:/testing full dcos:adminrouter:ops:mesos full dcos:adminrouter:ops:slave full - Install a service (in this example, Kafka) into a folder called
test. Go to Catalog, then search for beta-kafka. -
Click CONFIGURE and change the service name to
/testing/kafka, then deploy.The slashes in your service name are interpreted as folders. You are deploying Kafka in the
/testingfolder. Any user with access to the/testingfolder will have access to the service.
Important:
- Services cannot be renamed. Because the location of the service is specified in the name, you cannot move services between folders.
- DC/OS 1.9 and earlier does not accept slashes in service names. You may be able to create the service, but you will encounter unexpected problems.
Interacting with your foldered service
- Interact with your foldered service via the DC/OS CLI with this flag:
--name=/path/to/myservice. - To interact with your foldered service over the web directly, use
http://<dcos-url>/service/path/to/myservice. E.g.,http://<dcos-url>/service/testing/kafka/v1/endpoints.
Common Operations
This guide has so far focused on describing the components, how they work, and how to interact with them. At this point we’ll start looking at how that knowledge can be applied to a running service.
Initial service configuration
The DC/OS package format allows packages to define user-visible installation options. To ensure consistent installations, we recommend exporting the options you use into an options.json file, which can then be placed in source control and kept up to date with the current state of the cluster. Keeping these configurations around will make it easy to duplicate or reinstall services using identical configurations.
Use this CLI command to see what options are available for a given package:
$ dcos package describe elastic --config
{
  "properties": {
    "coordinator_nodes": {
      "description": "Elasticsearch coordinator node configuration properties",
      "properties": {
        "count": {
          "default": 1,
          "description": "Number of coordinator nodes to run",
          "minimum": 0,
          "type": "integer"
        },
        "cpus": {
          "default": 1.0,
          "description": "Node cpu requirements",
          "type": "number"
        },
        ...
      }
    }
    "service": {
      "description": "DC/OS service configuration properties",
      "properties": {
        ...
        "name": {
          "default": "elastic",
          "description": "The name of the Elasticsearch service instance",
          "type": "string"
        },
        ...
        "user": {
          "default": "core",
          "description": "The user that runs the Elasticsearch services and owns the Mesos sandbox.",
          "type": "string"
        }
      }
    }
  }
}
...
Given the above example, let’s build an elastic-prod-options.json that customizes the above values:
{
  "coordinator_nodes": {
    "count": 3,
    "cpus": 2.0
  },
  "service": {
    "name": "elastic-prod",
    "user": "elastic"
  }
}
Now that we have elastic-prod-options.json, we can install a service instance that uses it as follows:
$ dcos package install --options=elastic-prod-options.json elastic
Once we know the configuration is good, it should be added to our source control for tracking.
Updating service configuration
Above, we described how a configuration update (including updating the version of the service) is handled. Now we will quickly show the steps to perform such an update.
Configuration updates are performed by updating the process environment of the Scheduler. Once restarted, the Scheduler will observe this change and re-deploy nodes as described in Reconfiguration.
Enterprise DC/OS 1.10
Enterprise DC/OS 1.10 introduces a convenient command line option that allows for easier updates to a service’s configuration, as well as allowing users to inspect the status of an update, to pause and resume updates, and to restart or complete steps if necessary.
Prerequisites
- Enterprise DC/OS 1.10 or newer.
- A DC/OS SDK-based service with a version greater than 2.0.0-x.
- The DC/OS CLI installed and available.
- The service’s subcommand available and installed on your local machine.
- You can install just the subcommand CLI by running
dcos package install --cli <service-name>. - If you are running an older version of the subcommand CLI that doesn’t have the
updatecommand, uninstall and reinstall your CLI.dcos package uninstall --cli <service-name> dcos package install --cli <service-name>
- You can install just the subcommand CLI by running
Updating package version
The instructions below show how to safely update one version of a service to the next.
Viewing available versions
The update package-versions command allows you to view the versions of a service that you can upgrade or downgrade to. These are specified by the service maintainer and depend on the semantics of the service (i.e. whether or not upgrades are reversal).
For example, for dse, run:
$ dcos dse update package-versions
Upgrading or downgrading a service
- Before updating the service itself, update its CLI subcommand to the new version:
$ dcos package uninstall --cli dse $ dcos package install --cli dse --package-version="1.1.6-5.0.7" - Once the CLI subcommand has been updated, call the update start command, passing in the version. For example, to update
dseto version1.1.6-5.0.7:$ dcos dse update start --package-version="1.1.6-5.0.7"
If you are missing mandatory configuration parameters, the update command will return an error.
To supply missing configuration values or to override configuration values, you can also provide an options.json file (see Updating configuration below):
$ dcos dse update start --options=options.json --package-version="1.1.6-5.0.7"
The default behavior on update is to merge ‘Default’, ‘Stored’ and ‘Provided’ configurations, in that order, and then
validate against the schema. In some situations, such as when a schema option has been removed, the default behavior
might result in an invalid configuration. You can work around this with --replace=true which, when specified,
will override the ‘Stored’ options with the ‘Provided’ options.
$ dcos dse update start --options=options.json --replace=true --package-verion="1.1.6-5.0.7"
See Advanced update actions for commands you can use to inspect and manipulate an update after it has started.
Updating configuration
The instructions below describe how to update the configuration for a running DC/OS service.
Preparing configuration
If you installed this service with Enterprise DC/OS 1.10, you can fetch the full configuration of a service (including any default values that were applied during installation). For example, for dse:
$ dcos dse describe > options.json
Make any configuration changes to this options.json file.
If you installed this service with a prior version of DC/OS, this configuration will not have been persisted by the DC/OS package manager. You can instead use the options.json file that was used when installing the service.
Note: You need to specify all configuration values in the options.json file when performing a configuration update. Any unspecified values will be reverted to the default values specified by the DC/OS service. See the “Recreating options.json” section below for information on recovering these values.
####### Recreating options.json (optional)
If the options.json from when the service was last installed or updated is not available, you will need to manually recreate it using the following steps.
First, we’ll fetch the default application’s environment, current application’s environment, and the actual template that maps config values to the environment:
- Ensure you have jq installed.
- Set the service name that you’re using, in this example we’ll use
dse:$ SERVICE_NAME=dse - Get the version of the package that is currently installed:
$ PACKAGE_VERSION=$(dcos package list | grep $SERVICE_NAME | awk '{print $2}') - Then fetch and save the environment variables that have been set for the service:
$ dcos marathon app show $SERVICE_NAME | jq .env > current_env.json - To identify those values that are custom, we’ll get the default environment variables for this version of the service:
$ dcos package describe --package-version=$PACKAGE_VERSION --render --app $SERVICE_NAME | jq .env > default_env.json - We’ll also get the entire application template:
$ dcos package describe $SERVICE_NAME --app > marathon.json.mustache
Now that you have these files, we’ll attempt to recreate the options.json.
- Use JQ and
diffto compare the two:$ diff <(jq -S . default_env.json) <(jq -S . current_env.json) - Now compare these values to the values contained in the
envsection in application template:$ less marathon.json.mustache - Use the variable names (e.g.
{{service.name}}) to create a newoptions.jsonfile as described in Initial service configuration.
Starting the update
Once you are ready to begin, initiate an update using the DC/OS CLI, passing in the updated options.json file:
$ dcos dse update start --options=options.json
You will receive an acknowledgement message and the DC/OS package manager will restart the Scheduler in Marathon.
See Advanced update actions for commands you can use to inspect and manipulate an update after it has started.
Advanced update actions
The following sections describe advanced commands that be used to interact with an update in progress.
Monitoring the update
Once the Scheduler has been restarted, it will begin a new deployment plan as individual pods are restarted with the new configuration. Depending on the high availability characteristics of the service being updated, you may experience a service disruption.
You can query the status of the update as follows:
$ dcos dse update status
If the Scheduler is still restarting, DC/OS will not be able to route to it and this command will return an error message. Wait a short while and try again. You can also go to the Services tab of the DC/OS GUI to check the status of the restart.
Pause
To pause an ongoing update, issue a pause command:
$ dcos dse update pause
You will receive an error message if the plan has already completed or has been paused. Once completed, the plan will enter the WAITING state.
Resume
If a plan is in a WAITING state, as a result of being paused or reaching a breakpoint that requires manual operator verification, you can use the resume command to continue the plan:
$ dcos dse update resume
You will receive an error message if you attempt to resume a plan that is already in progress or has already completed.
Force Complete
In order to manually “complete” a step (such that the Scheduler stops attempting to launch a task), you can issue a force-complete command. This will instruct to Scheduler to mark a specific step within a phase as complete. You need to specify both the phase and the step, for example:
$ dcos dse update force-complete dse-phase dse-0:[node]
Force Restart
Similar to force complete, you can also force a restart. This can either be done for an entire plan, a phase, or just for a specific step.
To restart the entire plan:
$ dcos dse update force-restart
Or for all steps in a single phase:
$ dcos dse update force-restart dse-phase
Or for a specific step within a specific phase:
$ dcos dse update force-restart dse-phase dse-0:[node]
Open Source DC/OS, DC/OS 1.9, and Earlier
If you do not have Enterprise DC/OS 1.10 or later, the CLI commands above are not available. For Open Source DC/OS of any version, or Enterprise DC/OS 1.9 and earlier, you can perform changes from the DC/OS GUI.
-
Go to the Services tab of the DC/OS GUI and click the name of the Scheduler you wish to edit.
-
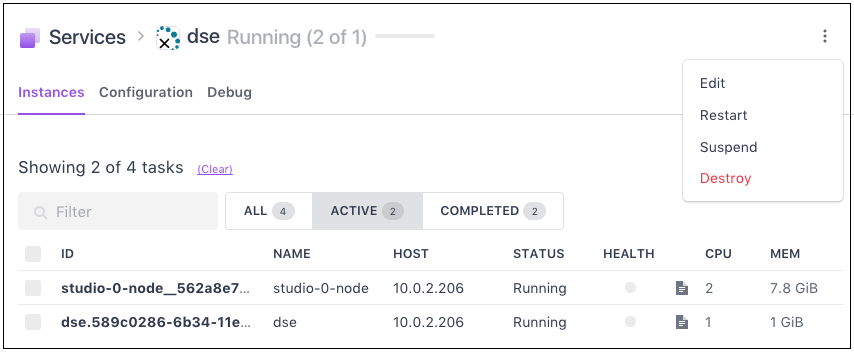
Click the three dots on the right hand side of the page for your Scheduler, then choose Edit.
-
In the window that appears, click the Environment tab to show a list of the Scheduler’s environment variables. For the sake of this demo, we will increase the
OPSCENTER_MEMvalue from4000to5000, thereby increasing the RAM quota for the OpsCenter task in this service. See finding the correct environment variable for more information on determining the correct value to be updated. - After you click
Change and deploy, the following will happen:- Marathon will restart the Scheduler so that it picks up our change.
- The Scheduler will detect that the OpsCenter task’s configuration has changed. The OpsCenter task will be restarted with the change applied. In this case, with allocated RAM increased from 4000 to 5000 MB.
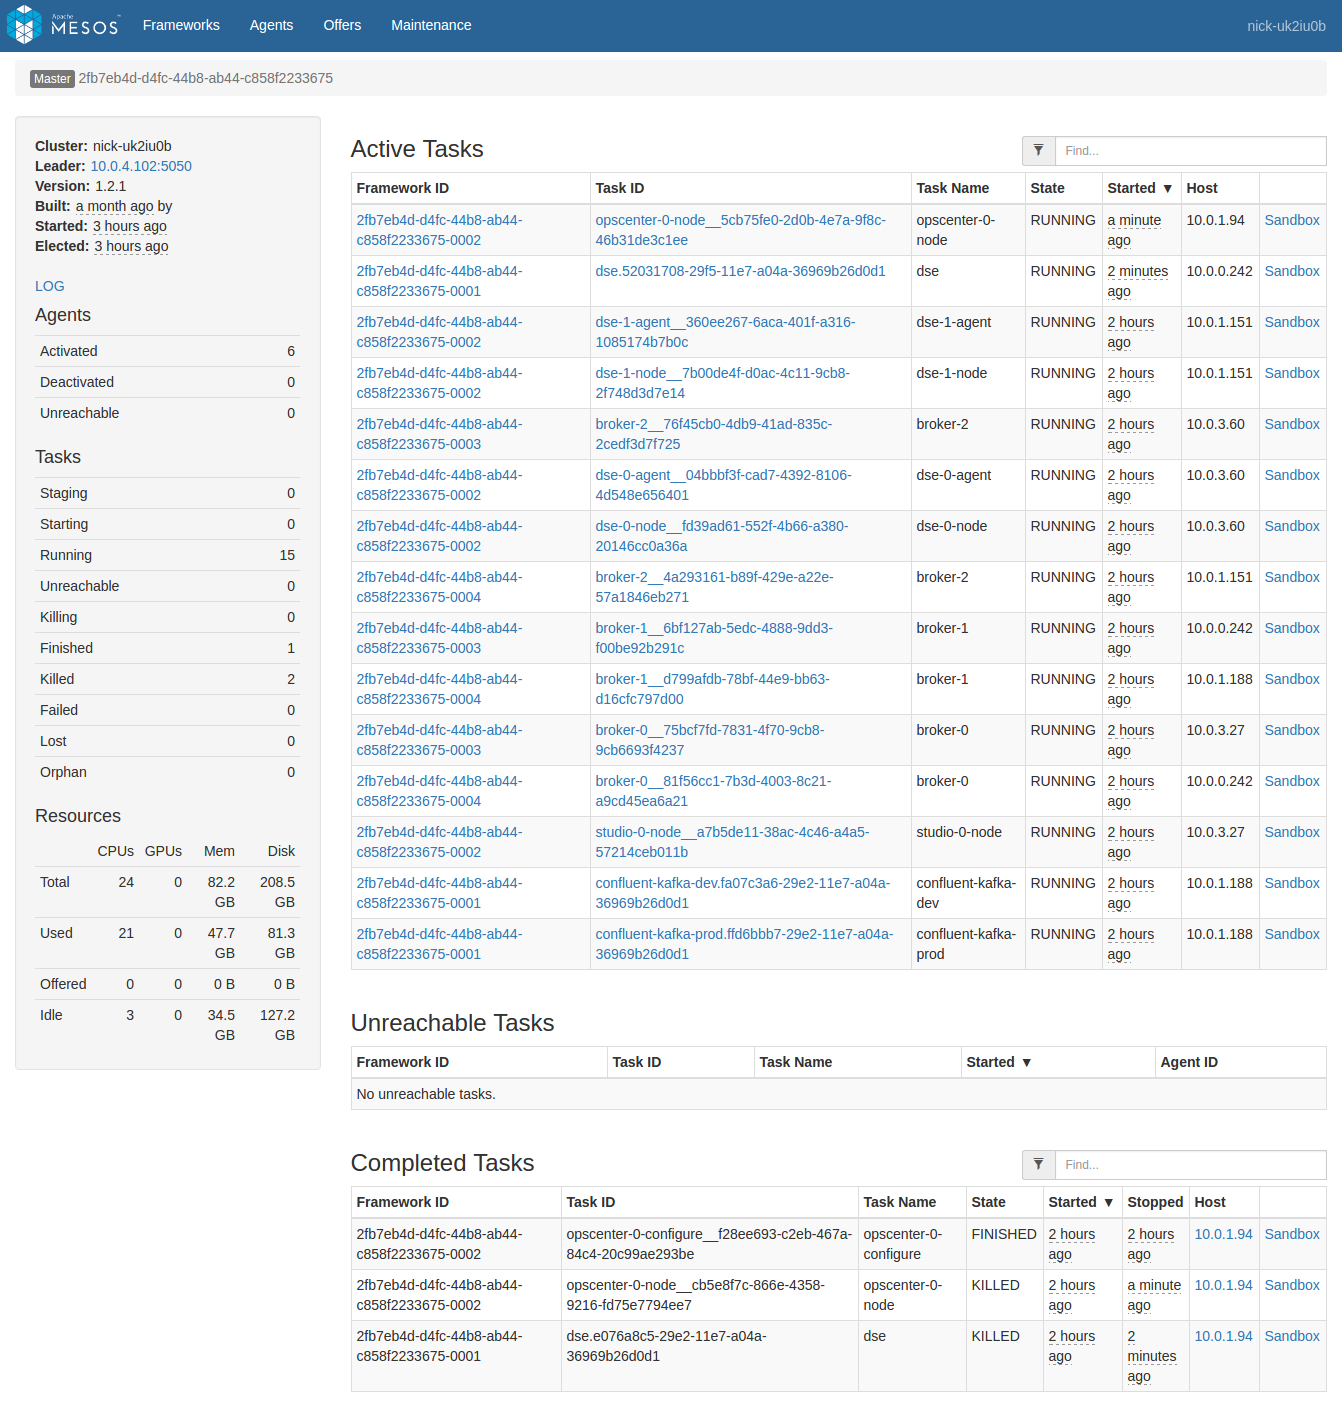
- We can see the result by looking at the Mesos task list. At the top we see the new
dseScheduler and new OpsCenter instance. At the bottom we see the previousdseScheduler and OpsCenter instance which were replaced due to our change:
If we look at the Scheduler logs, we can even see where it detected the change. The api-port value is random on each Scheduler restart, so it tends to always display as ‘different’ in this log. Because of this, the Scheduler automatically ignores changes to api-port, and so the change can be ignored here:
INFO  2017-04-25 20:26:08,343 [main] com.mesosphere.sdk.config.DefaultConfigurationUpdater:printConfigDiff(215): Difference between configs:
--- ServiceSpec.old
+++ ServiceSpec.new
@@ -3,5 +3,5 @@
   "role" : "dse-role",
   "principal" : "dse-principal",
-  "api-port" : 18446,
+  "api-port" : 15063,
   "web-url" : null,
   "ZooKeeper" : "master.mesos:2181",
@@ -40,5 +40,5 @@
             "type" : "SCALAR",
             "scalar" : {
-              "value" : 4000.0
+              "value" : 5000.0
             },
             "ranges" : null,
The steps above apply to any configuration change: the Scheduler is restarted, detects the config change, and then launches and/or restarts any affected tasks to reflect the change. When multiple tasks are affected, the Scheduler will follow the deployment Plan used for those tasks to redeploy them. In practice this typically means that each task will be deployed in a sequential rollout, where task N+1 is only redeployed after task N appears to be healthy and ready after being relaunched with the new configuration. Some services may have defined a custom update plan which invokes custom logic for rolling out changes which varies from the initial deployment rollout. The default behavior, when no custom update plan was defined, is to use the deploy plan.
Finding the correct environment variable
While DC/OS Enterprise 1.10+ supports changing the configuration using the option schema directly, DC/OS Open and versions 1.9 and earlier require mapping those options to the environment variables that are passed to the Scheduler.
The correct environment variable for a given setting can vary depending on the service. For instance, some services have multiple types of nodes, each with separate count settings. If you want to increase the number of nodes, it would take some detective work to find the correct environment variable.
For example, let’s look at the most recent release of confluent-kafka as of this writing. The number of brokers is configured using a count setting in the brokers section:
{
  "...": "...",
  "count": {
    "description":"Number of brokers to run",
    "type":"number",
    "default":3
  },
  "...": "..."
}
To see where this setting is passed when the Scheduler is first launched, we can look at the adjacent marathon.json.mustache template file. Searching for brokers.count in marathon.json.mustache reveals the environment variable that we should change:
{
  "...": "...",
  "env": {
    "...": "...",
    "BROKER_COUNT": "{{brokers.count}}",
    "...": "..."
  },
  "...": "..."
}
This method can be used mapping any configuration setting (applicable during initial install) to its associated Marathon environment variable (applicable during reconfiguration).
Uninstall
The uninstall flow was simplified for users as of DC/OS 1.10. The steps to uninstall a service therefore depends on the version of DC/OS:
DC/OS 1.10 and newer
If you are using DC/OS 1.10 and the installed service has a version greater than 2.0.0-x:
- Uninstall the service. From the DC/OS CLI, enter
dcos package uninstall --app-id=<instancename> <packagename>.
For example, to uninstall a Confluent Kafka instance named kafka-dev, run:
dcos package uninstall --app-id=kafka-dev confluent-kafka
Older versions
If you are running DC/OS 1.9 or older, or a version of the service that is older than 2.0.0-x, follow these steps:
- Stop the service. From the DC/OS CLI, enter
dcos package uninstall --app-id=<instancename> <packagename>. For example,dcos package uninstall --app-id=kafka-dev confluent-kafka. - Clean up remaining reserved resources with the
janitor.pyscript. See DC/OS documentation for more information about the cleaner script.
For example, to uninstall a Confluent Kafka instance named kafka-dev, run:
$ MY_SERVICE_NAME=kafka-dev
$ dcos package uninstall --app-id=$MY_SERVICE_NAME confluent-kafka`.
$ dcos node ssh --master-proxy --leader "docker run mesosphere/janitor /janitor.py \
    -r $MY_SERVICE_NAME-role \
    -p $MY_SERVICE_NAME-principal \
    -z dcos-service-$MY_SERVICE_NAME"
Pod operations
Most operations for maintaining a service will involve interacting with and manipulating its Pods.
Add or Remove a pod
Adding or removing pod instances within the service is treated as a configuration change, not a command.
In this case, we’re increasing a pod count value, as provided by the service’s configuration schema. In the case of the above dse service, we need to increase the configured dsenode.count from 3 (the default) to 4. After the change, the Scheduler will deploy a new DSE node instance without changing the preexisting nodes.
For safety reasons, pod instances cannot be removed after they have been deployed by default. However, some services may allow some pods to be removed in cases where doing so is not a problem. To remove pod instances, you would simply decrease the count value, and then instances exceeding that count will be removed automatically in reverse order. For example, if you decreased dsenode.count from 4 to 2 and this was allowed by the DSE service, you would see dsenode-3 be removed followed by dsenode-2, leaving only dsenode-0 and dsenode-1 still running. If the DSE service doesn’t allow the number of instances to be decreased, the Scheduler would instead reject the decrease and show a validation error in its deploy Plan.
Restart a pod
Restarting a pod keeps it in the current location and leaves data in any persistent volumes as-is. Data outside of those volumes is reset via the restart. Restarting a pod may be useful if an underlying process is broken in some way and just needs a kick to get working again. For more information see Recovery.
Restarting a pod can be done either via the CLI or via the underlying Scheduler API. Both forms use the same API. In these examples we list the known pods, and then restart the one named dse-1, which contains tasks named dse-1-agent and dse-1-node:
Via the CLI:
$ dcos datastax-dse --name=mydse pod list
[
  "dse-0",
  "dse-1",
  "dse-2",
  "opscenter-0",
  "studio-0"
]
$ dcos datastax-dse --name=mydse pod restart dse-1
{
  "pod": "dse-1",
  "tasks": [
    "dse-1-agent",
    "dse-1-node"
  ]
}
Via the HTTP API directly:
$ curl -k -H "Authorization: token=$(dcos config show core.dcos_acs_token)" <dcos-url>/service/dse/v1/pod
[
  "dse-0",
  "dse-1",
  "dse-2",
  "opscenter-0",
  "studio-0"
]
$ curl -k -X POST -H "Authorization: token=$(dcos config show core.dcos_acs_token)" <dcos-url>/service/dse/v1/pod/dse-1/restart
{
  "pod": "dse-1",
  "tasks": [
    "dse-1-agent",
    "dse-1-node"
  ]
}
All tasks within the pod are restarted as a unit. The response lists the names of the two tasks that were members of the pod.
Replace a pod
Replacing a pod discards all of its current data and moves it to a new random location in the cluster. As of this writing, you can technically end up replacing a pod and have it go back where it started. Replacing a pod may be useful if an agent machine has gone down and is never coming back, or if an agent is about to undergo downtime.
Pod replacement is not currently done automatically by the SDK, as making the correct decision requires operator knowledge of cluster status. Is a node really dead, or will it be back in a couple minutes? However, operators are free to build their own tooling to make this decision and invoke the replace call automatically. For more information see Recovery.
As with restarting a pod, replacing a pod can be done either via the CLI or by directly invoking the HTTP API. The response lists all the tasks running in the pod which were replaced as a result:
$ dcos datastax-dse --name=mydse pod replace dse-1
{
  "pod": "dse-1",
  "tasks": [
    "dse-1-agent",
    "dse-1-node"
  ]
}
$ curl -k -X POST -H "Authorization: token=$(dcos config show core.dcos_acs_token)" http://yourcluster.com/service/dse/v1/pod/dse-1/replace
{
  "pod": "dse-1",
  "tasks": [
    "dse-1-agent",
    "dse-1-node"
  ]
}
Pause a pod
Pausing a pod relaunches it in an idle command state. This allows the operator to debug the contents of the pod, possibly making changes to fix problems. While these problems are often fixed by just replacing the pod, there may be cases where an in-place repair or other operation is needed.
For example:
- A pod which crashes immediately upon starting may need additional work to be performed.
- Some services may require that certain repair operations be performed manually when the task itself isn’t running. Being able to put the pod in an offline but accessible state makes it easier to resolve these situations.
After the pod has been paused, it may be started again, at which point it will be restarted and will resume running task(s) where it left off.
Here is an example session where an index-1 pod is crash looping due to some corrupted data in a persistent volume. The operator pauses the index-1 pod, then uses task exec to repair the index. Following this, the operator starts the pod and it resumes normal operation:
$ dcos myservice debug pod pause index-1
{
  "pod": "index-1",
  "tasks": [
    "index-1-agent",
    "index-1-node"
  ]
}

$ dcos myservice pod status
myservice
├─ index
│  ├─ index-0
│  │  ├─ index-0-agent (COMPLETE)
│  │  └─ index-0-node (COMPLETE)
│  └─ index-1
│     ├─ index-1-agent (PAUSING)
│     └─ index-1-node (PAUSING)
└─ data
   ├─ data-0
   │  └─ data-0-node (COMPLETE)
   └─ data-1
      └─ data-1-node (COMPLETE)

... repeat "pod status" until index-1 tasks are PAUSED ...

$ dcos task exec --interactive --tty index-1-node /bin/bash
index-1-node$ ./repair-index && exit

$ dcos myservice debug pod resume index-1
{
  "pod": "index-1",
  "tasks": [
    "index-1-agent",
    "index-1-node"
  ]
}

$ dcos myservice pod status
myservice
├─ index
│  ├─ index-0
│  │  ├─ index-0-agent (RUNNING)
│  │  └─ index-0-node (RUNNING)
│  └─ index-1
│     ├─ index-1-agent (STARTING)
│     └─ index-1-node (STARTING)
└─ data
   ├─ data-0
   │  └─ data-0-node (RUNNING)
   └─ data-1
      └─ data-1-node (RUNNING)

... repeat "pod status" until index-1 tasks are RUNNING ...
In the above example, all tasks in the pod were being paused and started, but it’s worth noting that the commands also support pausing and starting individual tasks within a pod. For example, dcos myservice debug pod pause index-1 -t agent will pause only the agent task within the index-1 pod.
Plan Operations
This lists available commands for viewing and manipulating the Plans used by the Scheduler to perform work against the underlying service.
List
Show all plans for this service.
dcos kakfa plan list
Status
Display the status of the plan with the provided plan name.
dcos kafka plan status deploy
Note: The --json flag, though not default, is helpful in extracting phase UUIDs. Using the UUID instead of name for a
phase is a more ensures that the request, ie to pause or force-complete, is exactly the phase intended.
Start
Start the plan with the provided name and any optional plan arguments.
dcos kafka plan start deploy
Stop
Stop the running plan with the provided name.
dcos kafka plan stop deploy
Plan Pause differs from Plan Stop in the following ways:
- Pause can be issued for a specific phase or for all phases within a plan. Stop can only be issued for a plan.
- Pause updates the underlying Phase/Step state. Stop not only updates the underlying state, but also restarts the plan.
Pause
Pause the plan, or a specific phase in that plan with the provided phase name (or UUID).
dcos kafka plan pause deploy 97e70976-505f-4689-abd2-6286c4499091
NOTE: The UUID above is an example. Use the Plan Status command with the --json flag to extract a valid UUID.
Plan Pause differs from Plan Stop in the following ways:
- Pause can be issued for a specific phase or for all phases within a plan. Stop can only be issued for a plan.
- Pause updates the underlying Phase/Step state. Stop not only updated the underlying state, but also restarts the plan.
Resume
Resume the plan, or a specific phase in that plan, with the provided phase name (or UUID).
dcos kafka plan resume deploy 97e70976-505f-4689-abd2-6286c4499091
Force-Restart
Restart the plan with the provided name, or a specific phase in the plan, with the provided nam, or a specific step in a phase of the plan with the provided step name.
dcos kafka plan force-restart deploy
Force-Complete
Force complete a specific step in the provided phase. Example uses include the following: Abort a sidecar operation due to observed failure or due to known required manual preparation that was not performed.
dcos kafka plan force-complete deploy
Diagnostic Tools
DC/OS clusters provide several tools for diagnosing problems with services running in the cluster. In addition, the SDK has its own endpoints that describe what the Scheduler is doing at any given time.
Logging
The first step to diagnosing a problem is typically to take a look at the logs. Tasks do different things, so it takes some knowledge of the problem being diagnosed to determine which task logs are relevant.
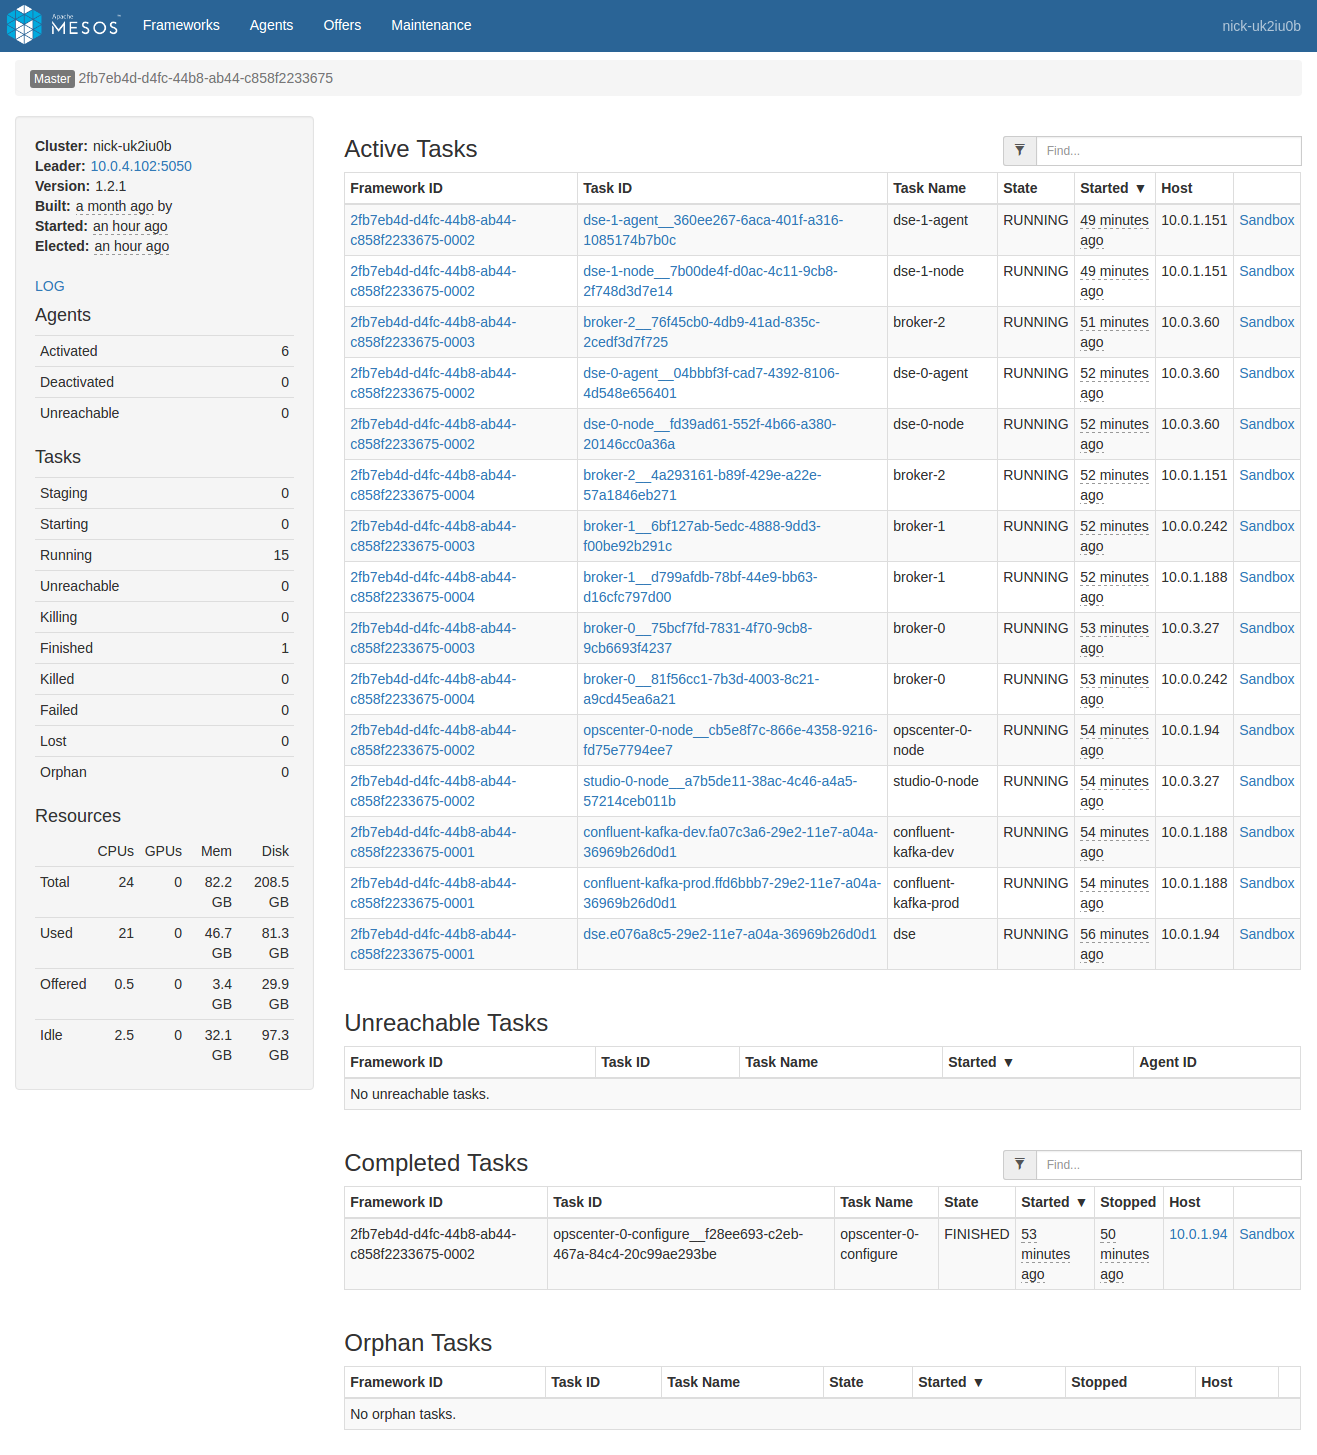
As of this writing, the best and fastest way to view and download logs is via the Mesos UI at <dcos-url>/mesos. On the Mesos front page you will see two lists: A list of currently running tasks, followed by a list of completed tasks (whether successful or failed).
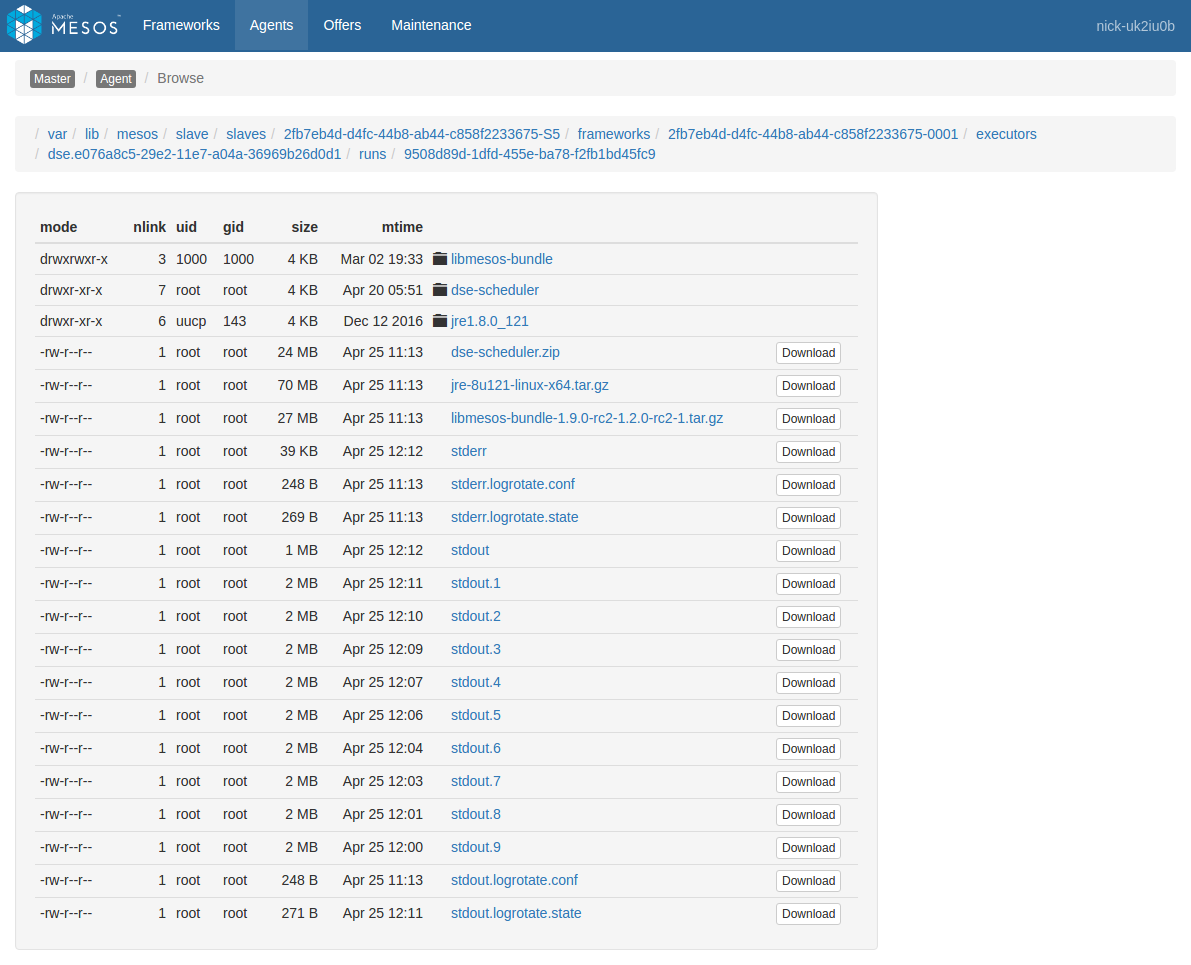
The Sandbox link for one of these tasks shows a list of files from within the task itself. For example, here’s a sandbox view of a broker-2 task from the above list:
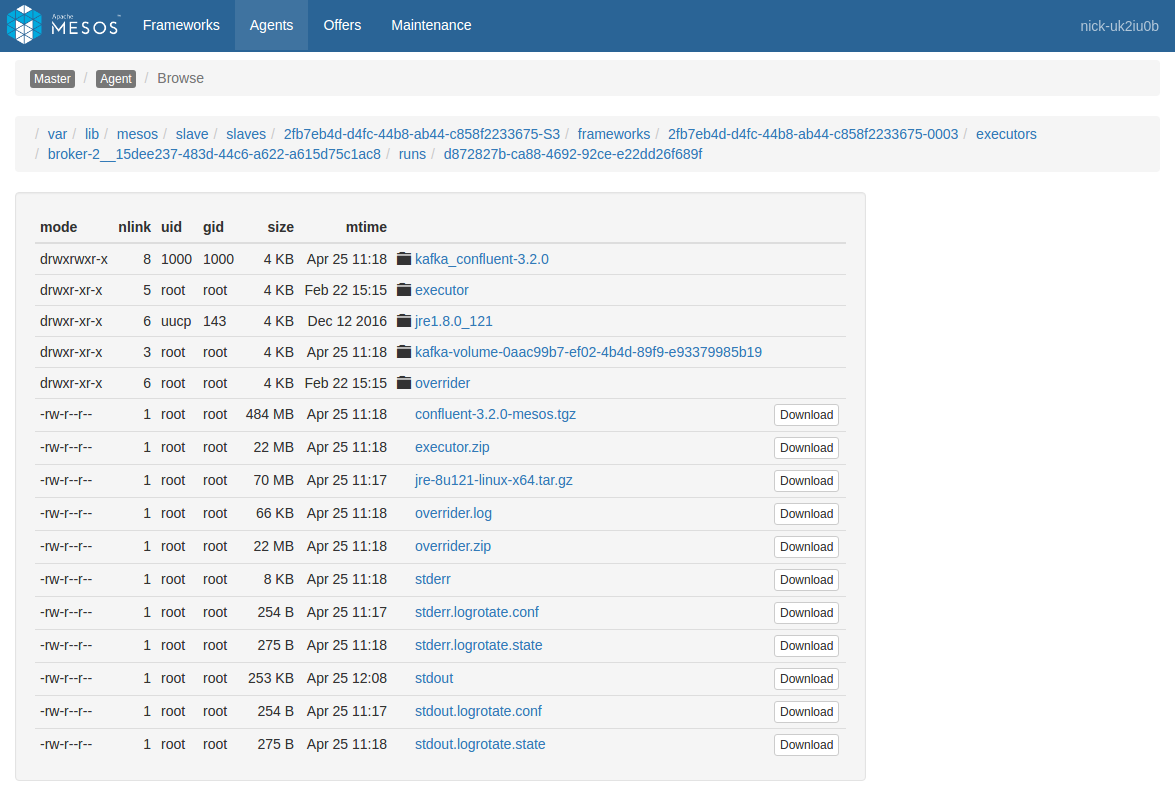
If the task is based on a Docker image, this list will only show the contents of /mnt/sandbox, and not the rest of the filesystem. If you need to view filesystem contents outside of this directory, you will need to use dcos task exec or nsenter as described below under Running commands within containers.
In the above task list there are multiple services installed, resulting in a pretty large list. The list can be filtered using the text box at the upper right, but there may be duplicate names across services. For example there are two instances of confluent-kafka and they’re each running a broker-0. As the cluster grows, this confusion gets proportionally worse. We want to limit the task list to only the tasks that are relevant to the service being diagnosed. To do this, click “Frameworks” on the upper left to see a list of all the installed frameworks (mapping to our services):
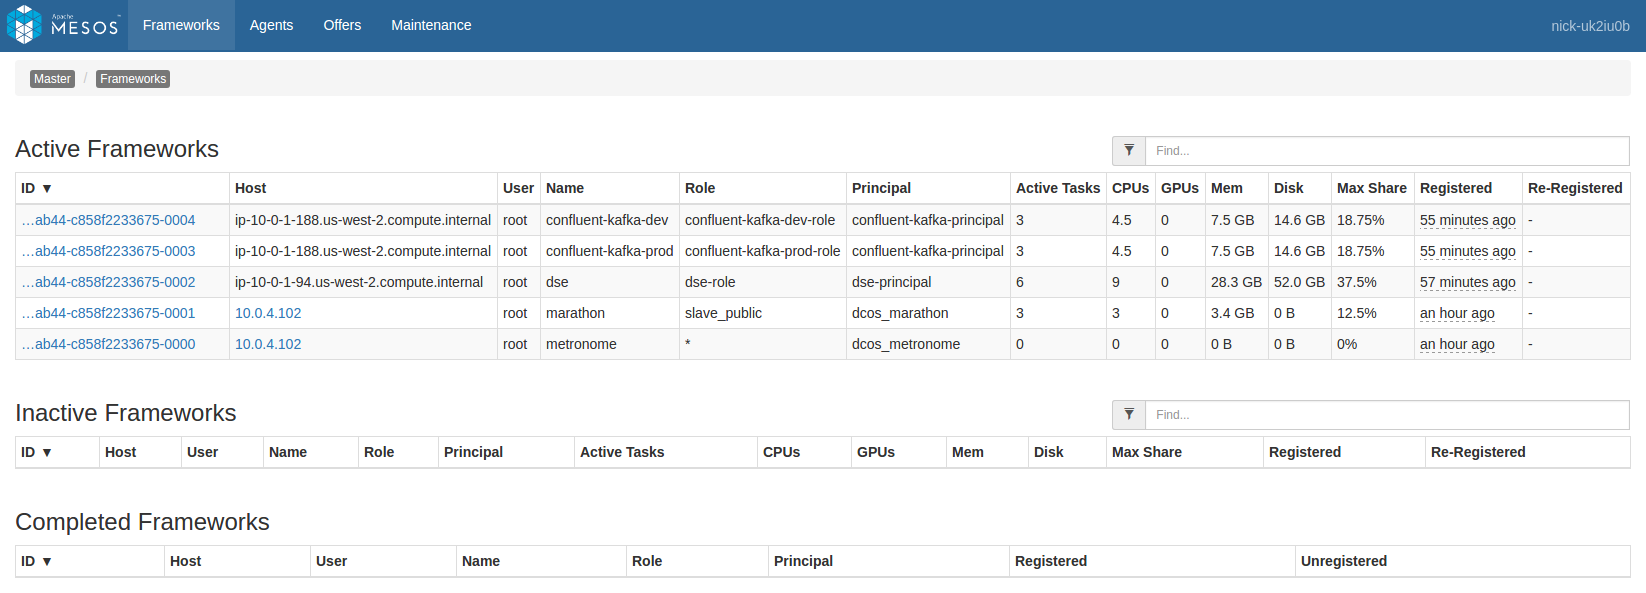
We then need to decide which framework to select from this list. This depends on what task we want to view:
Scheduler logs
If the issue is one of deployment or management, e.g. a service is ‘stuck’ in initial deployment, or a task that previously went down isn’t being brought back at all, then the Scheduler logs will likely be the place to find out why.
From Mesos’s perspective, the Scheduler is being run as a Marathon app. Therefore we should pick marathon from this list and then find our Scheduler in the list of tasks.

Scheduler logs can be found either via the main Mesos frontpage in small clusters (possibly using the filter box at the top right), or by navigating into the list of tasks registered against the marathon framework in large clusters. In SDK services, the Scheduler is typically given the same name as the service. For example a kafka-dev service’s Scheduler would be named kafka-dev. We click the Sandbox link to view the Sandbox portion of the Scheduler filesystem, which contains files named stdout and stderr. These files respectively receive the stdout/stderr output of the Scheduler process, and can be examined to see what the Scheduler is doing.
For a good example of the kind of diagnosis you can perform using SDK Scheduler logs, see the below use case of Tasks not deploying / Resource starvation.
Task logs
When the issue being diagnosed has to do with the service tasks, e.g. a given task is crash looping, the task logs will likely provide more information. The tasks being run as a part of a service are registered against a framework matching the service name. Therefore, we should pick <service-name> from this list to view a list of tasks specific to that service.

In the above list, we see separate lists of Active and Completed tasks:
- Active tasks are still running. These give a picture of the current activity of the service.
- Completed tasks have exited for some reason, whether successfully or due to a failure. These give a picture of recent activity of the service. Note: Older completed tasks will be automatically garbage collected and their data may no longer be available here.
Either or both of these lists may be useful depending on the context. Click on the Sandbox link for one of these tasks and then start looking at sandbox content. Files named stderr and stdout hold logs produced both by the SDK Executor process (a small wrapper around the service task) as well as any logs produced by the task itself. These files are automatically paginated at 2MB increments, so older logs may also be examined until they are automatically pruned. For an example of this behavior, see the scheduler sandbox linked earlier.
Mesos Agent logs
Occasionally, it can also be useful to examine what a given Mesos agent is doing. The Mesos Agent handles deployment of Mesos tasks to a given physical system in the cluster. One Mesos Agent runs on each system. These logs can be useful for determining if there’s a problem at the system level that is causing alerts across multiple services on that system.
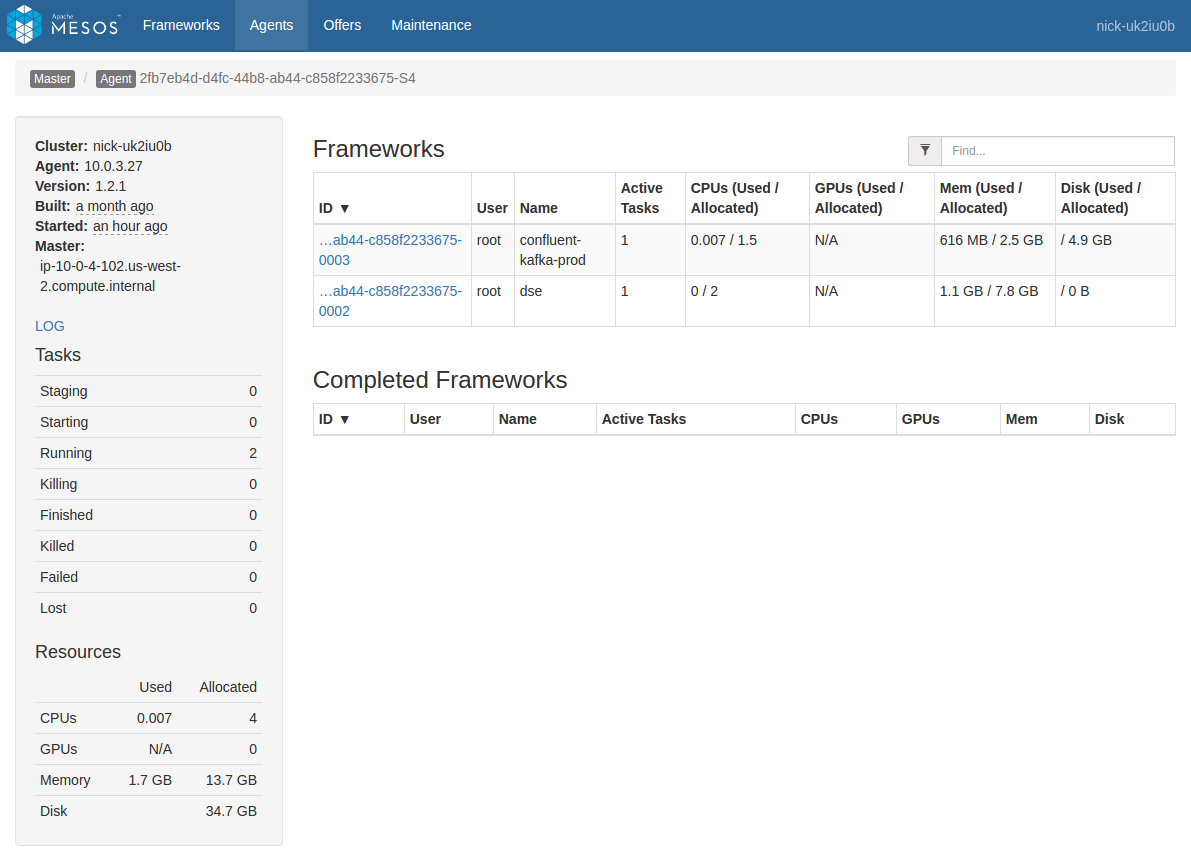
Navigate to the agent you want to view either directly from a task by clicking the “Agent” item in the breadcrumb when viewing a task (this will go directly to the agent hosting the task), or by navigating through the “Agents” menu item at the top of the screen (you will need to select the desired agent from the list).
In the Agent view, you’ll see a list of frameworks with a presence on that Agent. In the left pane you’ll see a plain link named “LOG”. Click that link to view the agent logs.
Logs via the CLI
You can also access logs via the DC/OS CLI using the dcos task log command. For example, lets assume the following list of tasks in a cluster:
$ dcos task
NAME                  HOST        USER  STATE  ID
broker-0              10.0.0.242  root    R    broker-0__81f56cc1-7b3d-4003-8c21-a9cd45ea6a21
broker-0              10.0.3.27   root    R    broker-0__75bcf7fd-7831-4f70-9cb8-9cb6693f4237
broker-1              10.0.0.242  root    R    broker-1__6bf127ab-5edc-4888-9dd3-f00be92b291c
broker-1              10.0.1.188  root    R    broker-1__d799afdb-78bf-44e9-bb63-d16cfc797d00
broker-2              10.0.1.151  root    R    broker-2__4a293161-b89f-429e-a22e-57a1846eb271
broker-2              10.0.3.60   root    R    broker-2__76f45cb0-4db9-41ad-835c-2cedf3d7f725
[...]
In this case we have two overlapping sets of brokers from two different Kafka installs. Given these tasks, we can do several different things by combining task filters, file selection, and the --follow argument:
$ dcos task log broker                # get recent stdout logs from all six 'broker-#' instances
$ dcos task log broker-0              # get recent stdout logs from two 'broker-0' instances
$ dcos task log broker-0__75          # get recent stdout logs from the 'broker-0' instance on 10.0.3.27
$ dcos task log --follow broker-0__75 # 'tail -f' the stdout logs from that broker instance
$ dcos task log broker-0__75 stderr   # get recent stderr logs from that broker instance
Metrics
DC/OS >= 1.11
The scheduler’s metrics are reported via three different mechanisms: JSON, prometheus and StatsD. The StatsD metrics are pushed to the address defined by the environment variables STATSD_UDP_HOST and STATSD_UDP_PORT. See DC/OS Metrics documentation for more details.
The JSON representation of the metrics is available at the /v1/metrics endpoint`.
####### JSON
{
	"version": "3.1.3",
	"gauges": {},
	"counters": {
		"declines.long": {
			"count": 15
		},
		"offers.processed": {
			"count": 18
		},
		"offers.received": {
			"count": 18
		},
		"operation.create": {
			"count": 5
		},
		"operation.launch_group": {
			"count": 3
		},
		"operation.reserve": {
			"count": 20
		},
		"revives": {
			"count": 3
		},
		"task_status.task_running": {
			"count": 6
		}
	},
	"histograms": {},
	"meters": {},
	"timers": {
		"offers.process": {
			"count": 10,
			"max": 0.684745927,
			"mean": 0.15145255818999337,
			"min": 5.367950000000001E-4,
			"p50": 0.0035879090000000002,
			"p75": 0.40317217800000005,
			"p95": 0.684745927,
			"p98": 0.684745927,
			"p99": 0.684745927,
			"p999": 0.684745927,
			"stddev": 0.24017017290826104,
			"m15_rate": 0.5944843686231079,
			"m1_rate": 0.5250565015924039,
			"m5_rate": 0.583689104996544,
			"mean_rate": 0.3809369986002824,
			"duration_units": "seconds",
			"rate_units": "calls/second"
		}
	}
}
The Prometheus representation of the metrics is available at the /v1/metrics/prometheus endpoint.
####### Prometheus
# HELP declines_long Generated from Dropwizard metric import (metric=declines.long, type=com.codahale.metrics.Counter)
# TYPE declines_long gauge
declines_long 20.0
# HELP offers_processed Generated from Dropwizard metric import (metric=offers.processed, type=com.codahale.metrics.Counter)
# TYPE offers_processed gauge
offers_processed 24.0
# HELP offers_received Generated from Dropwizard metric import (metric=offers.received, type=com.codahale.metrics.Counter)
# TYPE offers_received gauge
offers_received 24.0
# HELP operation_create Generated from Dropwizard metric import (metric=operation.create, type=com.codahale.metrics.Counter)
# TYPE operation_create gauge
operation_create 5.0
# HELP operation_launch_group Generated from Dropwizard metric import (metric=operation.launch_group, type=com.codahale.metrics.Counter)
# TYPE operation_launch_group gauge
operation_launch_group 4.0
# HELP operation_reserve Generated from Dropwizard metric import (metric=operation.reserve, type=com.codahale.metrics.Counter)
# TYPE operation_reserve gauge
operation_reserve 20.0
# HELP revives Generated from Dropwizard metric import (metric=revives, type=com.codahale.metrics.Counter)
# TYPE revives gauge
revives 4.0
# HELP task_status_task_finished Generated from Dropwizard metric import (metric=task_status.task_finished, type=com.codahale.metrics.Counter)
# TYPE task_status_task_finished gauge
task_status_task_finished 1.0
# HELP task_status_task_running Generated from Dropwizard metric import (metric=task_status.task_running, type=com.codahale.metrics.Counter)
# TYPE task_status_task_running gauge
task_status_task_running 8.0
# HELP offers_process Generated from Dropwizard metric import (metric=offers.process, type=com.codahale.metrics.Timer)
# TYPE offers_process summary
offers_process{quantile="0.5",} 2.0609500000000002E-4
offers_process{quantile="0.75",} 2.2853200000000001E-4
offers_process{quantile="0.95",} 0.005792643
offers_process{quantile="0.98",} 0.005792643
offers_process{quantile="0.99",} 0.111950848
offers_process{quantile="0.999",} 0.396119612
offers_process_count 244.0
Running commands within containers
An extremely useful tool for diagnosing task state is the ability to run arbitrary commands within the task. The available tools for doing this depend on the version of DC/OS you’re using:
DC/OS >= 1.9
DC/OS 1.9 introduced the task exec command as a convenient frontend to nsenter, which is described below.
Prerequisites
-
SSH keys for accessing your cluster configured (i.e. via
ssh-add). SSH is used behind the scenes to get into the cluster. -
A recent version of the DC/OS CLI with support for the
task execcommand.
Using dcos task exec
Once you’re set up, running commands is very straightforward. For example, let’s assume the list of tasks from the CLI logs section above, where there’s two broker-0 tasks, one named broker-0__81f56cc1-7b3d-4003-8c21-a9cd45ea6a21 and another named broker-0__75bcf7fd-7831-4f70-9cb8-9cb6693f4237. Unlike with task logs, we can only run task exec on one command at a time, so if two tasks match the task filter then we see the following error:
$ dcos task exec broker-0 echo hello world
There are multiple tasks with ID matching [broker-0]. Please choose one:
	broker-0__81f56cc1-7b3d-4003-8c21-a9cd45ea6a21
	broker-0__75bcf7fd-7831-4f70-9cb8-9cb6693f4237
Therefore we need to be more specific:
$ dcos task exec broker-0__75 echo hello world
hello world
$ dcos task exec broker-0__75 pwd
/
We can also run interactive commands using the -it flags (short for --interactive --tty):
$ dcos task exec --interactive --tty broker-0__75 /bin/bash
broker-container# echo hello world
hello world
broker-container# pwd
/
broker-container# exit
While you could technically change the container filesystem using dcos task exec, any changes will be destroyed if the container restarts.
DC/OS <= 1.8
DC/OS 1.8 and earlier do not support dcos task exec, but dcos node ssh and nsenter may be used instead to get the same thing, with a little more effort.
First, run dcos task to get the list of tasks (and their respective IPs), and cross-reference that with dcos node to get the list of agents (and their respective IPs). For example:
$ dcos task
NAME                  HOST        USER  STATE  ID
broker-0              10.0.1.151  root    R    broker-0__81f56cc1-7b3d-4003-8c21-a9cd45ea6a21
broker-0              10.0.3.27   root    R    broker-0__75bcf7fd-7831-4f70-9cb8-9cb6693f4237
$ dcos node
 HOSTNAME       IP                         ID
10.0.0.242  10.0.0.242  2fb7eb4d-d4fc-44b8-ab44-c858f2233675-S0
10.0.1.151  10.0.1.151  2fb7eb4d-d4fc-44b8-ab44-c858f2233675-S1
10.0.1.188  10.0.1.188  2fb7eb4d-d4fc-44b8-ab44-c858f2233675-S2
...
In this case we’re interested in the broker-0 on 10.0.1.151. We can see that broker-0’s Mesos Agent has an ID of 2fb7eb4d-d4fc-44b8-ab44-c858f2233675-S1. Let’s SSH into that machine using dcos node ssh:
$ dcos node ssh --master-proxy --mesos-id=2fb7eb4d-d4fc-44b8-ab44-c858f2233675-S1
agent-system$
Now that we’re logged into the host Agent machine, we need to find a relevant PID for the broker-0 container. This can take some guesswork:
agent-system$ ps aux | grep -i confluent
...
root      5772  0.6  3.3 6204460 520280 ?      Sl   Apr25   2:34 /var/lib/mesos/slave/slaves/2fb7eb4d-d4fc-44b8-ab44-c858f2233675-S0/frameworks/2fb7eb4d-d4fc-44b8-ab44-c858f2233675-0004/executors/broker-0__1eb65420-535e-477b-9ac1-797e79c15277/runs/f5377eac-3a87-4080-8b80-128434e42a25/jre1.8.0_121//bin/java ... kafka_confluent-3.2.0/config/server.properties
root      6059  0.7 10.3 6203432 1601008 ?     Sl   Apr25   2:43 /var/lib/mesos/slave/slaves/2fb7eb4d-d4fc-44b8-ab44-c858f2233675-S0/frameworks/2fb7eb4d-d4fc-44b8-ab44-c858f2233675-0003/executors/broker-1__8de30046-1016-4634-b43e-45fe7ede0817/runs/19982072-08c3-4be6-9af9-efcd3cc420d3/jre1.8.0_121//bin/java ... kafka_confluent-3.2.0/config/server.properties
...
As we can see above, there appear to be two likely candidates, one on PID 5772 and the other on PID 6059. The one on PID 5772 has mention of broker-0 so that’s probably the one we want. Lets run the nsenter command using PID 6059:
agent-system$ sudo nsenter --mount --uts --ipc --net --pid --target 6059
broker-container#
Looks like we were successful! Now we can run commands inside this container to verify that it’s the one we really want, and then proceed with the diagnosis.
Querying the Scheduler
The Scheduler exposes several HTTP endpoints that provide information on any current deployment as well as the Scheduler’s view of its tasks. For a full listing of HTTP endpoints, see the API reference. The Scheduler endpoints most useful to field diagnosis come from three sections:
- Plan: Describes any work that the Scheduler is currently doing, and what work it’s about to do. These endpoints also allow manually triggering Plan operations, or restarting them if they’re stuck.
- Pods: Describes the tasks that the Scheduler has currently deployed. The full task info describing the task environment can be retrieved, as well as the last task status received from Mesos.
- State: Access to other miscellaneous state information such as service-specific properties data.
For full documentation of each command, see the API Reference. Here is an example of invoking one of these commands against a service named hello-world via curl:
$ export AUTH_TOKEN=$(dcos config show core.dcos_acs_token)
$ curl -k -H "Authorization: token=$AUTH_TOKEN" https://<dcos_url>/service/hello-world/v1/plans/deploy
These endpoints may also be conveniently accessed using the SDK CLI after installing a service. See dcos <svcname> -h for a list of all commands. These are wrappers around the above API.
For example, let’s get a list of pods using the CLI, and then via the HTTP API:
$ dcos datastax-dse --name=mydse pod list
[
  "dse-0",
  "dse-1",
  "dse-2",
  "opscenter-0",
  "studio-0"
]
$ curl -k -H "Authorization: token=$(dcos config show core.dcos_acs_token)" <dcos-url>/service/dse/v1/pod
[
  "dse-0",
  "dse-1",
  "dse-2",
  "opscenter-0",
  "studio-0"
]
The -v (or --verbose) argument allows you to view and diagnose the underlying requests made by the CLI:
$ dcos datastax-dse --name=mydse -v pod list
2017/04/25 15:03:43 Running DC/OS CLI command: dcos config show core.dcos_url
2017/04/25 15:03:44 HTTP Query: GET https://yourcluster.com/service/dse/v1/pod
2017/04/25 15:03:44 Running DC/OS CLI command: dcos config show core.dcos_acs_token
2017/04/25 15:03:44 Running DC/OS CLI command: dcos config show core.ssl_verify
[
  "dse-0",
  "dse-1",
  "dse-2",
  "opscenter-0",
  "studio-0"
]
2017/04/25 15:03:44 Response: 200 OK (-1 bytes)
ZooKeeper/Exhibitor
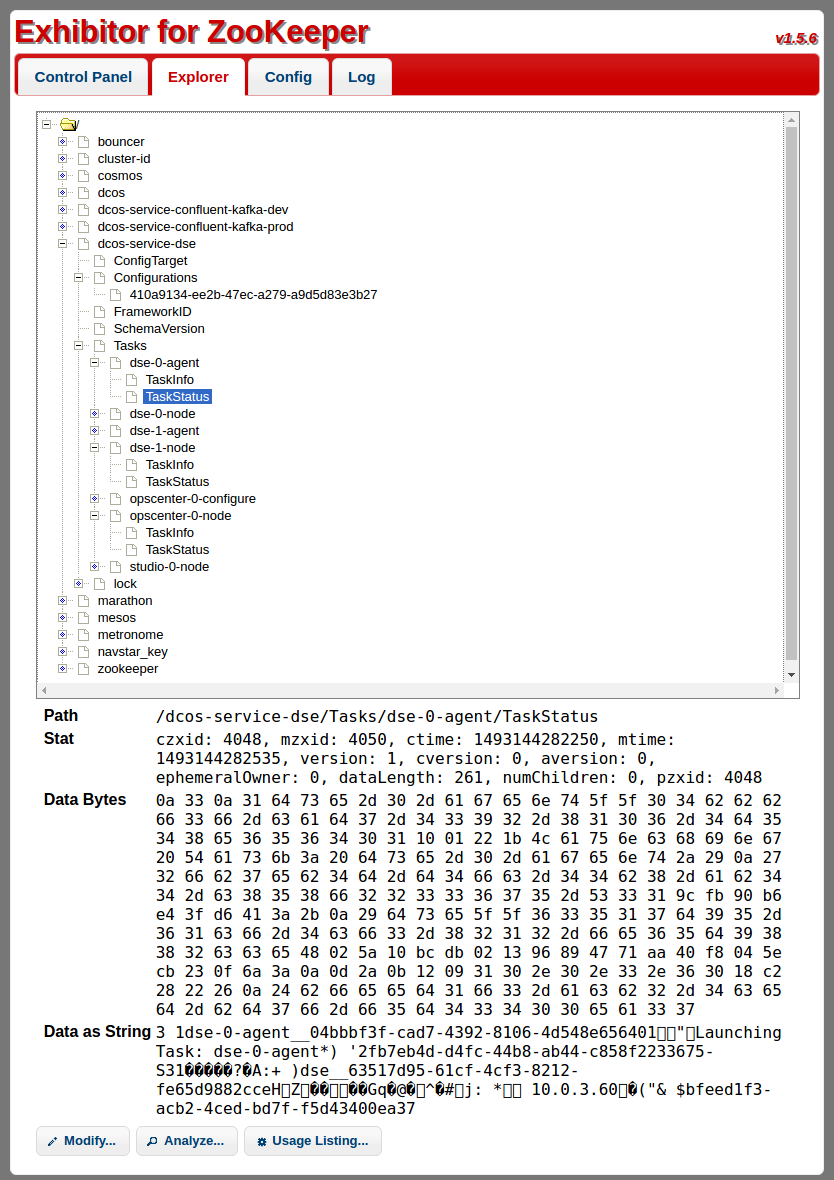
Break glass in case of emergency: This should only be used as a last resort. Modifying anything in ZooKeeper directly may cause your service to behave in inconsistent, even incomprehensible ways.
DC/OS comes with Exhibitor, a commonly used frontend for viewing ZooKeeper. Exhibitor may be accessed at <dcos-url>/exhibitor. A given SDK service will have a node named dcos-service-<svcname> visible here. This is where the Scheduler puts its state, so that it isn’t lost if the Scheduler is restarted. In practice it’s far easier to access this information via the Scheduler API (or via the service CLI) as described earlier, but direct access using Exhibitor can be useful in situations where the Scheduler itself is unavailable or otherwise unable to serve requests.
Troubleshooting
This section goes over some common pitfalls and how to fix them.
Tasks not deploying / Resource starvation
When the Scheduler is performing offer evaluation, it will log its decisions about offers it has received. This can be useful in the common case of determining why a task is failing to deploy.
In this example we have a newly-deployed dse Scheduler that isn’t deploying the third dsenode task that we requested. This can often happen if our cluster doesn’t have any machines with enough room to run the task.
In recent versions of the Scheduler, a Scheduler endpoint at http://yourcluster.com/service/<servicename>/v1/debug/offers will display an HTML table containing a summary of recently-evaluated offers. This table’s contents are currently very similar to what can be found in logs, but in a slightly more accessible format. Alternately, we can look at the Scheduler’s logs in stdout (or stderr in older SDK versions).
When looking at either the Offers debug endpoint, or at the Scheduler logs directly, we find several examples of offers that were insufficient to deploy the remaining node. It’s important to remember that offers will regularly be rejected due to not meeting the needs of a deployed task and that this is completely normal. What we’re looking for is a common theme across those rejections that would indicate what we’re missing.
From scrolling through the scheduler logs, we see a couple of patterns. First, there are failures like this, where the only thing missing is CPUs. The remaining task requires 2 CPUs but this offer apparently didn’t have enough:
INFO  2017-04-25 19:17:13,846 [pool-8-thread-1] com.mesosphere.sdk.offer.evaluate.OfferEvaluator:evaluate(69): Offer 1: failed 1 of 14 evaluation stages:
  PASS(PlacementRuleEvaluationStage): No placement rule defined
  PASS(ExecutorEvaluationStage): Offer contains the matching Executor ID
  PASS(ResourceEvaluationStage): Offer contains sufficient 'cpus': requirement=type: SCALAR scalar { value: 0.5 }
  PASS(ResourceEvaluationStage): Offer contains sufficient 'mem': requirement=type: SCALAR scalar { value: 500.0 }
  PASS(LaunchEvaluationStage): Added launch information to offer requirement
  FAIL(ResourceEvaluationStage): Failed to satisfy required resource 'cpus': name: "cpus" type: SCALAR scalar { value: 2.0 } role: "dse-role" reservation { principal: "dse-principal" labels { labels { key: "resource_id" value: "" } } }
  PASS(ResourceEvaluationStage): Offer contains sufficient 'mem': requirement=type: SCALAR scalar { value: 8000.0 }
  PASS(MultiEvaluationStage): All child stages passed
    PASS(PortEvaluationStage): Offer contains sufficient 'ports': requirement=type: RANGES ranges { range { begin: 9042 end: 9042 } }
    PASS(PortEvaluationStage): Offer contains sufficient 'ports': requirement=type: RANGES ranges { range { begin: 9160 end: 9160 } }
    PASS(PortEvaluationStage): Offer contains sufficient 'ports': requirement=type: RANGES ranges { range { begin: 7000 end: 7000 } }
    PASS(PortEvaluationStage): Offer contains sufficient 'ports': requirement=type: RANGES ranges { range { begin: 7001 end: 7001 } }
    PASS(PortEvaluationStage): Offer contains sufficient 'ports': requirement=type: RANGES ranges { range { begin: 8609 end: 8609 } }
    PASS(PortEvaluationStage): Offer contains sufficient 'ports': requirement=type: RANGES ranges { range { begin: 8182 end: 8182 } }
    PASS(PortEvaluationStage): Offer contains sufficient 'ports': requirement=type: RANGES ranges { range { begin: 7199 end: 7199 } }
    PASS(PortEvaluationStage): Offer contains sufficient 'ports': requirement=type: RANGES ranges { range { begin: 21621 end: 21621 } }
    PASS(PortEvaluationStage): Offer contains sufficient 'ports': requirement=type: RANGES ranges { range { begin: 8983 end: 8983 } }
    PASS(PortEvaluationStage): Offer contains sufficient 'ports': requirement=type: RANGES ranges { range { begin: 7077 end: 7077 } }
    PASS(PortEvaluationStage): Offer contains sufficient 'ports': requirement=type: RANGES ranges { range { begin: 7080 end: 7080 } }
    PASS(PortEvaluationStage): Offer contains sufficient 'ports': requirement=type: RANGES ranges { range { begin: 7081 end: 7081 } }
  PASS(VolumeEvaluationStage): Offer contains sufficient 'disk'
  PASS(VolumeEvaluationStage): Offer contains sufficient 'disk'
  PASS(VolumeEvaluationStage): Offer contains sufficient 'disk'
  PASS(VolumeEvaluationStage): Offer contains sufficient 'disk'
  PASS(LaunchEvaluationStage): Added launch information to offer requirement
  PASS(ReservationEvaluationStage): Added reservation information to offer requirement
If we scroll up from this rejection summary, we find a message describing what the agent had offered in terms of CPU:
INFO 2017-04-25 19:17:13,834 [pool-8-thread-1] com.mesosphere.sdk.offer.MesosResourcePool:consumeUnreservedMerged(239): Offered quantity of cpus is insufficient: desired type: SCALAR scalar { value: 2.0 }, offered type: SCALAR scalar { value: 0.5 }
Understandably, our Scheduler is refusing to launch a DSE node on a system with 0.5 remaining CPUs when the DSE node needs 2.0 CPUs.
Another pattern we see is a message like this, where the offer is being rejected for several reasons:
INFO  2017-04-25 19:17:14,849 [pool-8-thread-1] com.mesosphere.sdk.offer.evaluate.OfferEvaluator:evaluate(69): Offer 1: failed 6 of 14 evaluation stages:
  PASS(PlacementRuleEvaluationStage): No placement rule defined
  PASS(ExecutorEvaluationStage): Offer contains the matching Executor ID
  FAIL(ResourceEvaluationStage): Failed to satisfy required resource 'cpus': name: "cpus" type: SCALAR scalar { value: 0.5 } role: "dse-role" reservation { principal: "dse-principal" labels { labels { key: "resource_id" value: "" } } }
  PASS(ResourceEvaluationStage): Offer contains sufficient 'mem': requirement=type: SCALAR scalar { value: 500.0 }
  PASS(LaunchEvaluationStage): Added launch information to offer requirement
  FAIL(ResourceEvaluationStage): Failed to satisfy required resource 'cpus': name: "cpus" type: SCALAR scalar { value: 2.0 } role: "dse-role" reservation { principal: "dse-principal" labels { labels { key: "resource_id" value: "" } } }
  FAIL(ResourceEvaluationStage): Failed to satisfy required resource 'mem': name: "mem" type: SCALAR scalar { value: 8000.0 } role: "dse-role" reservation { principal: "dse-principal" labels { labels { key: "resource_id" value: "" } } }
  FAIL(MultiEvaluationStage): Failed to pass all child stages
    FAIL(PortEvaluationStage): Failed to satisfy required resource 'ports': name: "ports" type: RANGES ranges { range { begin: 9042 end: 9042 } } role: "dse-role" reservation { principal: "dse-principal" labels { labels { key: "resource_id" value: "" } } }
    FAIL(PortEvaluationStage): Failed to satisfy required resource 'ports': name: "ports" type: RANGES ranges { range { begin: 9160 end: 9160 } } role: "dse-role" reservation { principal: "dse-principal" labels { labels { key: "resource_id" value: "" } } }
    FAIL(PortEvaluationStage): Failed to satisfy required resource 'ports': name: "ports" type: RANGES ranges { range { begin: 7000 end: 7000 } } role: "dse-role" reservation { principal: "dse-principal" labels { labels { key: "resource_id" value: "" } } }
    FAIL(PortEvaluationStage): Failed to satisfy required resource 'ports': name: "ports" type: RANGES ranges { range { begin: 7001 end: 7001 } } role: "dse-role" reservation { principal: "dse-principal" labels { labels { key: "resource_id" value: "" } } }
    FAIL(PortEvaluationStage): Failed to satisfy required resource 'ports': name: "ports" type: RANGES ranges { range { begin: 8609 end: 8609 } } role: "dse-role" reservation { principal: "dse-principal" labels { labels { key: "resource_id" value: "" } } }
    FAIL(PortEvaluationStage): Failed to satisfy required resource 'ports': name: "ports" type: RANGES ranges { range { begin: 8182 end: 8182 } } role: "dse-role" reservation { principal: "dse-principal" labels { labels { key: "resource_id" value: "" } } }
    FAIL(PortEvaluationStage): Failed to satisfy required resource 'ports': name: "ports" type: RANGES ranges { range { begin: 7199 end: 7199 } } role: "dse-role" reservation { principal: "dse-principal" labels { labels { key: "resource_id" value: "" } } }
    FAIL(PortEvaluationStage): Failed to satisfy required resource 'ports': name: "ports" type: RANGES ranges { range { begin: 21621 end: 21621 } } role: "dse-role" reservation { principal: "dse-principal" labels { labels { key: "resource_id" value: "" } } }
    FAIL(PortEvaluationStage): Failed to satisfy required resource 'ports': name: "ports" type: RANGES ranges { range { begin: 8983 end: 8983 } } role: "dse-role" reservation { principal: "dse-principal" labels { labels { key: "resource_id" value: "" } } }
    FAIL(PortEvaluationStage): Failed to satisfy required resource 'ports': name: "ports" type: RANGES ranges { range { begin: 7077 end: 7077 } } role: "dse-role" reservation { principal: "dse-principal" labels { labels { key: "resource_id" value: "" } } }
    FAIL(PortEvaluationStage): Failed to satisfy required resource 'ports': name: "ports" type: RANGES ranges { range { begin: 7080 end: 7080 } } role: "dse-role" reservation { principal: "dse-principal" labels { labels { key: "resource_id" value: "" } } }
    FAIL(PortEvaluationStage): Failed to satisfy required resource 'ports': name: "ports" type: RANGES ranges { range { begin: 7081 end: 7081 } } role: "dse-role" reservation { principal: "dse-principal" labels { labels { key: "resource_id" value: "" } } }
  FAIL(VolumeEvaluationStage): Failed to satisfy required volume 'disk': name: "disk" type: SCALAR scalar { value: 10240.0 } role: "dse-role" disk { persistence { id: "" principal: "dse-principal" } volume { container_path: "dse-data" mode: RW } } reservation { principal: "dse-principal" labels { labels { key: "resource_id" value: "" } } }
  PASS(VolumeEvaluationStage): Offer contains sufficient 'disk'
  PASS(VolumeEvaluationStage): Offer contains sufficient 'disk'
  FAIL(VolumeEvaluationStage): Failed to satisfy required volume 'disk': name: "disk" type: SCALAR scalar { value: 10240.0 } role: "dse-role" disk { persistence { id: "" principal: "dse-principal" } volume { container_path: "solr-data" mode: RW } } reservation { principal: "dse-principal" labels { labels { key: "resource_id" value: "" } } }
  PASS(LaunchEvaluationStage): Added launch information to offer requirement
  PASS(ReservationEvaluationStage): Added reservation information to offer requirement
In this case, we see that none of the ports our DSE task needs are available on this system (not to mention the lack of sufficient CPU and RAM). This will typically happen when we’re looking at an agent that we’ve already deployed to. The agent in question here is likely running either dsenode-0 or dsenode-1, where we had already reserved those ports ourselves.
We’re seeing that none of the remaining agents in the cluster have room to fit our dsenode-2. To resolve this, we need to either add more agents to the DC/OS cluster or we need to reduce the requirements of our service to make it fit. In the latter case, be aware of any performance issues that may result if resource usage is reduced too far. Insufficient CPU quota will result in throttled tasks, and insufficient RAM quota will result in OOMed tasks.
This is a good example of the kind of diagnosis you can perform by skimming the SDK Scheduler logs.
Accidentially deleted Marathon task but not service
A common user mistake is to remove the Scheduler task from Marathon, which doesn’t do anything to uninstall the service tasks themselves. If you do this, you have two options:
Uninstall the rest of the service
If you really wanted to uninstall the service, you just need to complete the normal package uninstall steps described under Uninstall.
Recover the Scheduler
If you want to bring the Scheduler back, you can do a dcos package install using the options that you had configured before. This will re-install a new Scheduler that should match the previous one (assuming you got your options right), and it will resume where it left off. To ensure that you don’t forget the options your services are configured with, we recommend keeping a copy of your service’s options.json in source control so that you can easily recover it later. See also Initial configuration.
‘Framework has been removed’
Long story short, you forgot to run janitor.py the last time you ran the service. See Uninstall for steps on doing that. In case you’re curious, here’s what happened:
- You ran
dcos package uninstall. This destroyed the scheduler and its associated tasks, but didn’t clean up its reserved resources. - Later on, you tried to reinstall the service. The Scheduler came up and found an entry in ZooKeeper with the previous framework ID, which would have been cleaned up by
janitor.py. The Scheduler tried to re-register using that framework ID. - Mesos returned an error because it knows that framework ID is no longer valid. Hence the confusing ‘Framework has been removed’ error.
Stuck deployments
You can sometimes get into valid situations where a deployment is being blocked by a repair operation or vice versa. For example, say you were rolling out an update to a 500 node Cassandra cluster. The deployment gets paused at node #394 because it’s failing to come back, and, for whatever reason, we don’t have the time or the inclination to pod replace it and wait for it to come back.
In this case, we can use plan commands to force the Scheduler to skip node #394 and proceed with the rest of the deployment:
$ dcos cassandra plan status deploy
{
  "phases": [
    {
      "id": "aefd33e3-af78-425e-ad2e-6cc4b0bc1907",
      "name": "cassandra-phase",
      "steps": [
        ...
        { "id": "f108a6a8-d41f-4c49-a1c0-4a8540876f6f", "name": "node-393:[node]", "status": "COMPLETE" },
        { "id": "83a7f8bc-f593-452a-9ceb-627d101da545", "name": "node-394:[node]", "status": "PENDING" }, # stuck here
        { "id": "61ce9d7d-b023-4a8a-9191-bfa261ace064", "name": "node-395:[node]", "status": "PENDING" },
        ...
      ],
      "status": "IN_PROGRESS"
    },
    ...
  ],
  "errors": [],
  "status": "IN_PROGRESS"
}
$ dcos plan force deploy cassandra-phase node-394:[node]
{
  "message": "Received cmd: forceComplete"
}
After forcing the node-394:[node] step, we can then see that the Plan shows it in a COMPLETE state, and that the Plan is proceeding with node-395:
$ dcos cassandra plan status deploy
{
  "phases": [
    {
      "id": "aefd33e3-af78-425e-ad2e-6cc4b0bc1907",
      "name": "cassandra-phase",
      "steps": [
        ...
        { "id": "f108a6a8-d41f-4c49-a1c0-4a8540876f6f", "name": "node-393:[node]", "status": "COMPLETE" },
        { "id": "83a7f8bc-f593-452a-9ceb-627d101da545", "name": "node-394:[node]", "status": "COMPLETE" },
        { "id": "61ce9d7d-b023-4a8a-9191-bfa261ace064", "name": "node-395:[node]", "status": "PENDING" },
        ...
      ],
      "status": "IN_PROGRESS"
    },
    ...
  ],
  "errors": [],
  "status": "IN_PROGRESS"
}
If we want to go back and fix the deployment of that node, we can simply force the scheduler to treat it as a pending operation again:
$ dcos plan restart deploy cassandra-phase node-394:[node]
{
  "message": "Received cmd: restart"
}
Now, we see that the step is again marked as PENDING as the Scheduler again attempts to redeploy that node:
$ dcos cassandra plan status deploy
{
  "phases": [
    {
      "id": "aefd33e3-af78-425e-ad2e-6cc4b0bc1907",
      "name": "cassandra-phase",
      "steps": [
        ...
        { "id": "f108a6a8-d41f-4c49-a1c0-4a8540876f6f", "name": "node-393:[node]", "status": "COMPLETE" },
        { "id": "83a7f8bc-f593-452a-9ceb-627d101da545", "name": "node-394:[node]", "status": "PENDING" },
        { "id": "61ce9d7d-b023-4a8a-9191-bfa261ace064", "name": "node-395:[node]", "status": "COMPLETE" },
        ...
      ],
      "status": "IN_PROGRESS"
    },
    ...
  ],
  "errors": [],
  "status": "IN_PROGRESS"
}
This example shows how steps in the deployment Plan (or any other Plan) can be manually retriggered or forced to a completed state by querying the Scheduler. This doesn’t come up often, but it can be a useful tool in certain situations.
Note: The dcos plan commands will also accept UUID id values instead of the name values for the phase and step arguments. Providing UUIDs avoids the possibility of a race condition where we view the plan, then it changes structure, then we change a plan step that isn’t the same one we were expecting (but which had the same name).
Deleting a task in ZooKeeper to forcibly wipe that task
If the scheduler is still failing after pod replace <name> to clear a task, a last resort is to use Exhibitor to delete the offending task from the Scheduler’s ZooKeeper state, and then to restart the Scheduler task in Marathon so that it picks up the change. After the Scheduler restarts, it will do the following:
- Automatically unreserve the task’s previous resources with Mesos because it doesn’t recognize them anymore (via the Resource Cleanup operation described earlier).
- Automatically redeploy the task on a new agent.
Note: This operation can easily lead to a completely broken service. Do this at your own risk. Break glass in case of emergency
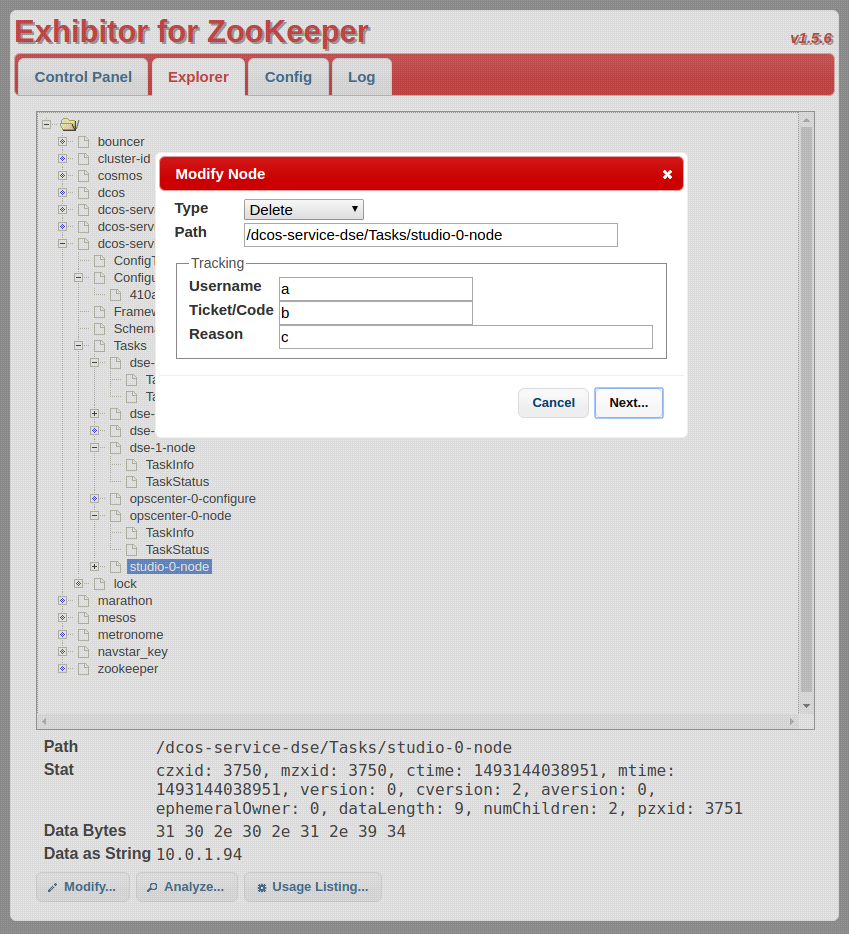
OOMed task
Your tasks can be killed from an OOM if you didn’t give them sufficient resources. This will manifest as sudden Killed messages in Task logs, sometimes consistently but often not. To verify that the cause is an OOM, the following places can be checked:
- Check Scheduler logs (or
dcos <svcname> pod status <podname>)to see TaskStatus updates from mesos for a given failed pod. - Check Agent logs directly for mention of the Mesos Agent killing a task due to excess memory usage.
After you’ve been able to confirm that the problem is indeed an OOM, you can solve it by either updating the service configuration to reserve more memory, or configuring the underlying service itself to use less memory (assuming the option is available).