Monitoring ArangoDB using collectd
Problem
The ArangoDB web interface shows a nice summary of the current state. I want to see similar numbers in my monitoring system so I can analyze the system usage post mortem or send alarms on failure.
Solution
Collectd is an excellent tool to gather all kinds of metrics from a system and deliver it to a central monitoring like Graphite and / or Nagios.
Ingredients
For this recipe you need to install the following tools:
- collectd >= 5.4.2 The aggregation Daemon
- kcollectd for inspecting the data
Configuring collectd
For aggregating the values we will use the cURL-JSON plug-in. We will store the values using the Round-Robin-Database writer(RRD) which kcollectd can later on present to you.
We assume your collectd comes from your distribution and reads its config from /etc/collectd/collectd.conf. Since this file tends to become pretty unreadable quickly, we use the include mechanism:
<Include "/etc/collectd/collectd.conf.d">
  Filter "*.conf"
</Include>
This way we can make each metric group on compact set config files. It consists of three components:
- loading the plug-in
- adding metrics to the TypesDB
- the configuration for the plug-in itself
rrdtool
We will use the Round-Robin-Database as storage backend for now. It creates its own database files of fixed size for each specific time range. Later you may choose more advanced writer-plug-ins, which may do network distribution of your metrics or integrate the above mentioned Graphite or your already established monitoring, etc.
For the RRD we will go pretty much with defaults:
# Load the plug-in:
LoadPlugin rrdtool
<Plugin rrdtool>
   DataDir "/var/lib/collectd/rrd"
#  CacheTimeout 120
#  CacheFlush 900
#  WritesPerSecond 30
#  CreateFilesAsync false
#  RandomTimeout 0
#
# The following settings are rather advanced
# and should usually not be touched:
#   StepSize 10
#   HeartBeat 20
#   RRARows 1200
#   RRATimespan 158112000
#   XFF 0.1
</Plugin>
cURL JSON
Collectd comes with a wide range of metric aggregation plug-ins. Many tools today use JSON as data formating grammar; so does ArangoDB. Therefore a plug-in offering to fetch JSON documents via HTTP is the perfect match as an integration interface:
# Load the plug-in:
LoadPlugin curl_json
# we need to use our own types to generate individual names for our gauges:
TypesDB "/etc/collectd/collectd.conf.d/arangodb_types.db"
<Plugin curl_json>
  # Adjust the URL so collectd can reach your arangod:
  <URL "http://localhost:8529/_db/_system/_admin/aardvark/statistics/short">
   # Set your authentication to Aardvark here:
   # User "foo"
   # Password "bar"
    <Key "totalTimeDistributionPercent/values/0">
       Type "totalTimeDistributionPercent_values"
     </Key>
     <Key "totalTimeDistributionPercent/cuts/0">
       Type "totalTimeDistributionPercent_cuts"
     </Key>
     <Key "requestTimeDistributionPercent/values/0">
       Type "requestTimeDistributionPercent_values"
     </Key>
     <Key "requestTimeDistributionPercent/cuts/0">
       Type "requestTimeDistributionPercent_cuts"
     </Key>
     <Key "queueTimeDistributionPercent/values/0">
       Type "queueTimeDistributionPercent_values"
     </Key>
     <Key "queueTimeDistributionPercent/cuts/0">
       Type "queueTimeDistributionPercent_cuts"
     </Key>
     <Key "bytesSentDistributionPercent/values/0">
       Type "bytesSentDistributionPercent_values"
     </Key>
     <Key "bytesSentDistributionPercent/cuts/0">
       Type "bytesSentDistributionPercent_cuts"
     </Key>
     <Key "bytesReceivedDistributionPercent/values/0">
       Type "bytesReceivedDistributionPercent_values"
     </Key>
     <Key "bytesReceivedDistributionPercent/cuts/0">
       Type "bytesReceivedDistributionPercent_cuts"
     </Key>
     <Key "numberOfThreadsCurrent">
       Type "gauge"
     </Key>
     <Key "numberOfThreadsPercentChange">
       Type "gauge"
     </Key>
     <Key "virtualSizeCurrent">
       Type "gauge"
     </Key>
     <Key "virtualSizePercentChange">
       Type "gauge"
     </Key>
     <Key "residentSizeCurrent">
       Type "gauge"
     </Key>
     <Key "residentSizePercent">
       Type "gauge"
     </Key>
     <Key "asyncPerSecondCurrent">
       Type "gauge"
     </Key>
     <Key "asyncPerSecondPercentChange">
       Type "gauge"
     </Key>
     <Key "syncPerSecondCurrent">
       Type "gauge"
     </Key>
     <Key "syncPerSecondPercentChange">
       Type "gauge"
     </Key>
     <Key "clientConnectionsCurrent">
       Type "gauge"
     </Key>
     <Key "clientConnectionsPercentChange">
       Type "gauge"
     </Key>
     <Key "physicalMemory">
       Type "gauge"
     </Key>
     <Key "nextStart">
       Type "gauge"
     </Key>
     <Key "waitFor">
       Type "gauge"
     </Key>
     <Key "numberOfThreads15M">
       Type "gauge"
     </Key>
     <Key "numberOfThreads15MPercentChange">
       Type "gauge"
     </Key>
     <Key "virtualSize15M">
       Type "gauge"
     </Key>
     <Key "virtualSize15MPercentChange">
       Type "gauge"
     </Key>
     <Key "asyncPerSecond15M">
       Type "gauge"
     </Key>
     <Key "asyncPerSecond15MPercentChange">
       Type "gauge"
     </Key>
     <Key "syncPerSecond15M">
       Type "gauge"
     </Key>
     <Key "syncPerSecond15MPercentChange">
       Type "gauge"
     </Key>
     <Key "clientConnections15M">
       Type "gauge"
     </Key>
     <Key "clientConnections15MPercentChange">
       Type "gauge"
     </Key>
  </URL>
</Plugin>
To circumvent the shortcoming of the curl_JSON plug-in to only take the last path element as name for the metric, we need to give them a name using our own types.db file in /etc/collectd/collectd.conf.d/arangodb_types.db:
totalTimeDistributionPercent_values        value:GAUGE:U:U
totalTimeDistributionPercent_cuts        value:GAUGE:U:U
requestTimeDistributionPercent_values        value:GAUGE:U:U
requestTimeDistributionPercent_cuts        value:GAUGE:U:U
queueTimeDistributionPercent_values        value:GAUGE:U:U
queueTimeDistributionPercent_cuts        value:GAUGE:U:U
bytesSentDistributionPercent_values        value:GAUGE:U:U
bytesSentDistributionPercent_cuts        value:GAUGE:U:U
bytesReceivedDistributionPercent_values        value:GAUGE:U:U
bytesReceivedDistributionPercent_cuts        value:GAUGE:U:U
Rolling your own
You may want to monitor your own metrics from ArangoDB. Here is a simple example how to use the config:
{
 "testArray":[1,2],
 "testArrayInbetween":[{"blarg":3},{"blub":4}],
 "testDirectHit":5,
 "testSubLevelHit":{"oneMoreLevel":6}
}
This config snippet will parse the JSON above:
<Key "testArray/0">
  Type "gauge"
  # Expect: 1
</Key>
<Key "testArray/1">
  Type "gauge"
  # Expect: 2
</Key>
<Key "testArrayInbetween/0/blarg">
  Type "gauge"
  # Expect: 3
</Key>
<Key "testArrayInbetween/1/blub">
  Type "gauge"
  # Expect: 4
</Key>
<Key "testDirectHit">
  Type "gauge"
  # Expect: 5
</Key>
<Key "testSubLevelHit/oneMoreLevel">
  Type "gauge"
  # Expect: 6
</Key
Get it served
Now we will (re)start collectd so it picks up our configuration:
/etc/init.d/collectd start
We will inspect the syslog to revalidate nothing went wrong:
Mar  3 13:59:52 localhost collectd[11276]: Starting statistics collection and monitoring daemon: collectd.
Mar  3 13:59:52 localhost systemd[1]: Started LSB: manage the statistics collection daemon.
Mar  3 13:59:52 localhost collectd[11283]: Initialization complete, entering read-loop.
Collectd adds the hostname to the directory address, so now we should have files like these:
-rw-r--r-- 1 root root 154888 Mar 2 16:53 /var/lib/collectd/rrd/localhost/curl_json-default/gauge-numberOfThreads15M.rrd
Now we start kcollectd to view the values in the RRD file:
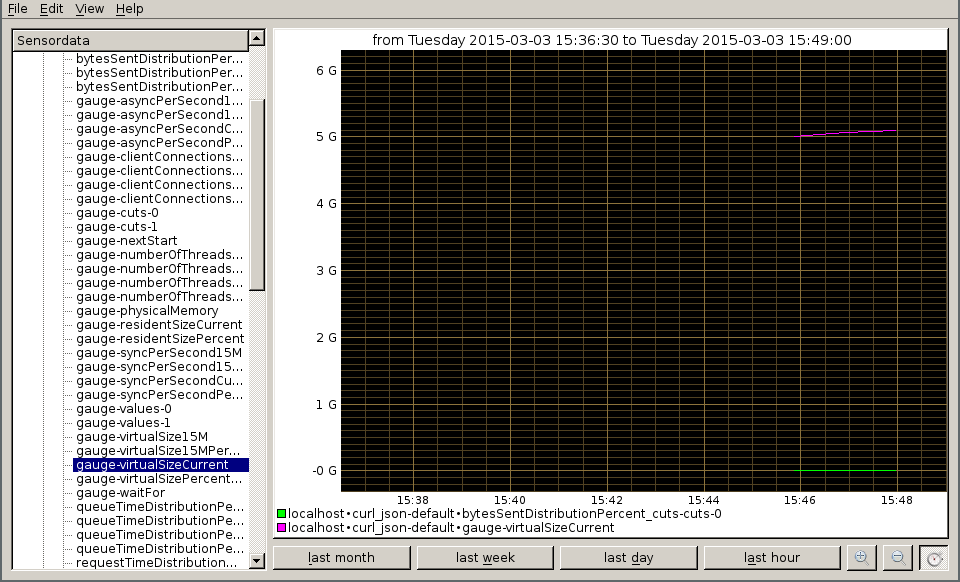
Since we started putting values in just now, we need to choose 'last hour' and zoom in a little more to inspect the values.
Finished with this dish, wait for more metrics to come in other recipes.
Author: Wilfried Goesgens
Tags: #json #monitoring