Netflow Export & Analyses
Netflow is a monitoring feature, invented by Cisco, it is implemented in the FreeBSD kernel with ng_netflow (Netgraph). Since Netgraph is a kernel implementation it is very fast with little overhead compared to softflowd or pfflowd.
While many monitoring solutions such as Nagios, Cacti and vnstat only capture traffic statistics, Netflow captures complete packet flows including source, destination ip and port number.
OPNsense offers full support for exporting Netflow data to external collectors as well as a comprehensive Analyzer for on-the-box analysis and live monitoring.
OPNsense is the only open source solution with a build-in Netflow analyzer integrated into it’s Graphical User Interface.
Supported Versions
OPNsense support both Netflow version 5 (IPv4) and version 9 (IPv4 & IPv6).
Netflow Basics
For analyzing the flow data it is important to understand the difference between ingress and egress traffic.
Ingress
Traffic to or coming from the firewall.
Egress
Traffic passing trough the firewall.
Ingress + Egress = Double flow count
When enabling both ingress and egress, traffic gets counted double due to Network Address Translation as all packets going to the WAN coming from the LAN pass the Network translation of the firewall therefor also creating an ingress flow.
If you are not interested in ingress traffic then OPNsense offers the option to filter this traffic. When utilizing a proxy on the same device its important to capture the ingress flows as well, otherwise all proxy traffic won’t be visible. Downside is of course that all traffic not passing the proxy will we counted twice due to the mentioned NAT effect.
Netflow Exporter
OPNsense Netflow Exporter supports multiple interfaces, filtering of ingress flows and multiple destinations including local capture for analysis by Insight (OPNsense Netflow Analyzer).

Netflow Analyzer - Insight
OPNsense offers a full Netflow Analyzer with the following features:
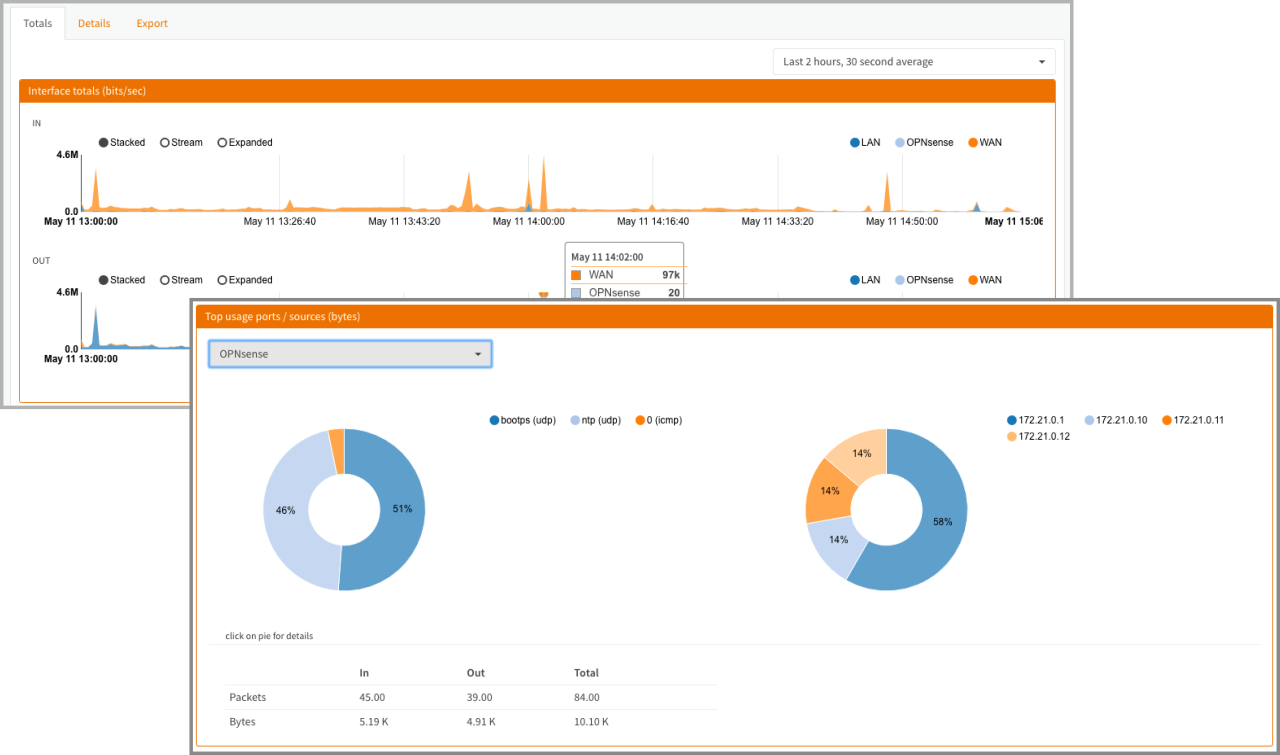
Captures 5 detail levels
- Last 2 hours, 30 second average
- Last 8 hours, 5 minute averagae
- Last week, 1 hour average
- Last month, 24 hour average
- Last year, 24 hour average
Graphical representation of flows (stacked, stream and expanded)
Top usage per interface, both ips and ports.
Full in/out traffic in packets and bytes
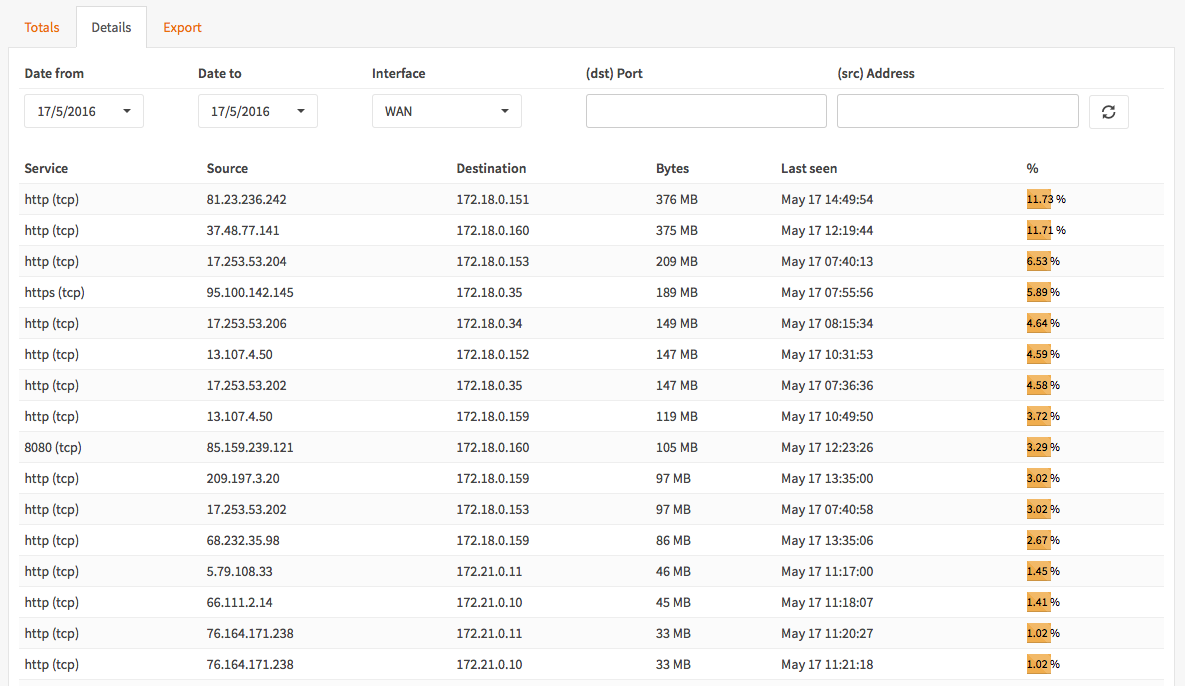
Detailed view with date selection and port/ip filter (up to 2 months)
Data export to csv for offline analysis
- Selectable Detail Level
- Selectable Resolution
- Selectable Dat range