Developer Guide to the BPEL Designer: Testing and Debugging BPEL Processes
Contributed by Bob May, maintained by Irina Filippova
December 2007
Contents
Developer Guide to the BPEL Designer
Testing a BPEL Process
Testing a deployed business process application involves using test cases that act as remote partner services which send SOAP messages to the BPEL Service Engine runtime.
In simple words, the interaction process is the following: The BPEL Service Engine runtime receives the SOAP message and creates an instance of the BPEL process and starts executing the instance. A BPEL process can have many running instances. The BPEL Service Engine runtime receives a message and, using correlation, routes it to the appropriate instance of the process. If an instance does not yet exist, a new instance is created.
To test-run a deployed business process application, you need to configure test cases to act as remote partner services sending SOAP messages to the BPEL Service Engine runtime.
Creating and Running a Test Case
In order to obtain test results you must do the following:
-
Add a test case and bind it to a BPEL operation.
-
Set the test properties.
-
Customize test input.
-
Run the Tester.
All steps in this section assume the following:
Adding/Binding a Test Case
To add a test case and bind it to a BPEL operation:
-
In the IDE Projects window, open the Composite Application project to expose its Test folder.
-
Right-click Test, and choose pop-up menu item New Test Case.
This launches the New Test Case wizard.
-
In the Enter the Test Case Name step, enter a name for the test case and click Next.
-
In the Select the WSDL Document step, open the BPEL Module project, select the .wsdl file containing the operation you want to test, and then click Next.
-
In the next step, select the operation you want to test, and then click Finish.
In the project tree, under Test, a new folder is created in the form of an upper case T, containing two files: Input.xml and Output.xml.
Note: If you view the test case in the Files window, you see Concurrent.properties as a third file.
Setting the Test Properties
To set the test properties:
-
In the Projects window, under the Composite Application project's node, right-click the node for the test case and choose Properties from the pop-up menu.
-
Set the properties of the test case as follows:
-
Description : string
-
User-entered text to help user know what the test is about.
-
Destination : URL (from the .wsdl file's <soap:address location="THIS"> tag)
-
Identifies the location of the web service to be tested.
-
SoapAction (default: blank)
-
-
Input File (read-only; generated by system)
-
Name of the input file. This file contains the input data for the test case.
-
Output File (read-only; generated by system)
-
Name of the output file. This file contains the output data for the test case.
-
Concurrent Threads : integer; default = 1
-
Each thread can invoke the test case multiple times (see the following property). Thus, if conc=2 and inv=3, the test case will be run 6 times (two threads, each run thrice).
-
Invokes Per Thread : integer; default = 1
-
Number of times each thread invokes the test case.
-
Test Timeout (sec) : integer; default = 30
-
How long each thread has to finish. If it does not finish in the allotted time, then an exception is thrown.
-
Calculate Throughput : boolean
-
If the checkbox is selected, then throughput statistics are calculated. Example: If a test specifies two threads and three invokes per thread, and if the test takes 15 seconds for the 6 invocations, then the statistics report an average of 2.5 seconds each.
-
Comparison Type : drop-down list with the following options:
-
-
identical: Considers the output and actual output as a stream of characters.
-
binary: Considers the output and actual output as a stream of bytes.
-
equals: Considers the output and actual output as a XML documents.
-
Feature Status : drop-down list with the following options:
-
-
progress: Marks test completion as "success", regardless of actual outcome.
-
done: Records actual outcome of test.
Customizing Test Input
To customize test input:
-
In the Projects window, expand the Test node and the node for a specific test case.
- Right-click Input.xml and click Edit.
-
Modify the contents as needed. For example, wherever you see <value>?string?</value> click within ?string? and replace it with a string of any length. However, within such strings, do not include the characters < (less-than sign) or & (ampersand) unless you use them with XML semantics.
-
When you are satisfied, click Save.
-
Right-click Output.xml and click Edit to examine the contents:
-
It is empty. This is a special state that triggers a special operation when the test is run.
-
Each time the test is run, the current output is compared to the contents of Output.xml. If any differences are detected, they will be stored in the Actual_yymmddhhmmss.xml file under the test case folder. However, in the special case where Output.xml starts null, then the output is written to Output.xml.
-
In each run after the first, assuming Output.xml is no longer null, its contents are preserved. In other words, a previous output is never overwritten by new results.
Running the Tester
To run a single test case:
- In the Projects window, expand the Composite Application project > Test, right-click the node for the specific test case and choose Run.
To run all test cases in a project:
-
Right-click the Composite Application project and choose Test Project from the pop-up menu.
Looking at Test Case Results
-
The first run correctly reports that it failed. This happens because the output produced does not match the (empty) Output.xml file, and the file’s null content is replaced with the output of the first run.
- Test results are shown in the JUnit test results window, which opens automatically when you run a test case.
-
If you run the test again without changing the input, second and subsequent runs report success, since the output matches the contents of Output.xml.
-
If you change the value in the Input.xml and re-run the test, then:
-
If the feature-status property is set to progress, then the test indicates success even though a mismatch occurred.
-
If the feature-status property is set to done, then the test indicates failure.
-
If you right-click the test case node and click Diff in the pop-up menu, the window displays the difference between the latest output and the contents of Output.xml.
top
Debugging BPEL Processes
Debugging BPEL processes follows the same general principles as debugging Java applications. Debugging BPEL processes involves setting breakpoints in the source code and executing the process step-by-step within a debugging session. The BPEL Debugger visually represents the execution of a BPEL process and allows you to view and change variables, monitor the results of executing expressions, and use fault breakpoints tomonitor the state of variables before a fault is thrown.
Steps in Debugging BPEL Processes
The main steps in debugging BPEL processes are:
-
Confirm that the GlassFish application server has started.
- Create test cases.
For sample processes, test cases are automatically created; for new projects, you need to create at least one test case.
- Open the BPEL process file either in the Source view or Design view.
-
Set breakpoints in the code or on the diagram. Optionally, add watches for XPath expressions in your process or add fault breakpoints.
-
Start a debugging session. Watch the BPEL Debugger Console window for confirmation that the debugging session has started.
-
Within the debugging session, run one or several test cases.
- View execution of BPEL processes on the diagram in the Design view or in the BPEL Process Execution window and view running instances of BPEL processes in the BPEL Process Instances window.
-
When an instance stops at a breakpoint, step through the code or the diagram, examine the values of variables in the BPEL Variables window, or observe the values of XPath expressions in the Watches window.
-
Finish the debugging session.
Starting and Finishing a BPEL Debugging Session
A debugging session begins when you connect the BPEL Debugger to the BPEL Service Engine. Only one debugging session can be running with the BPEL Service Engine at a given time.
After a BPEL debugging session starts, you can execute process instances step-by-step, inspecting the values of BPEL variables and XPath expressions in the BPEL Variables and Watches windows. You can monitor the execution of a BPEL process within a debugger session on the diagram in the Design view: the activities that are being executed are highlighted on the diagram as the current execution position advances. The BPEL Process Execution window also shows the execution of the BPEL process.
To prepare the debugging environment:
-
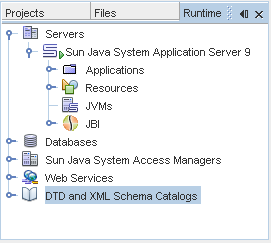
In the Services window, make sure that the GlassFish V2 Application Server is running. The Application Server is running if it has subnodes and is marked with a green triangle.
If the server is not started, right-click it and choose Start from the pop-up menu. For details about how to start the Application Server, see the BPEL Service Engine section.
-
Set breakpoints in the BPEL process.
-
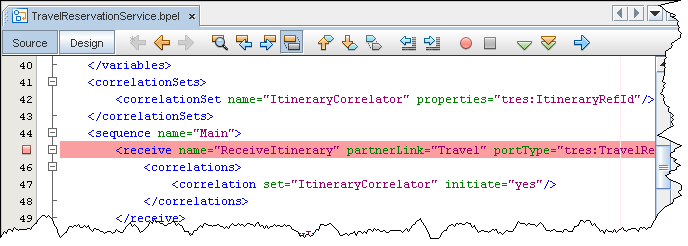
To set breakpoints in the Source view, click next to the line where you want to set the breakpoint.
-
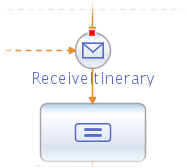
To set breakpoints on the diagram, switch to the Design view, right-click the element and choose Toggle Breakpoint from the pop-up menu.
A red square appears at the top of the element with a breakpoint.
-
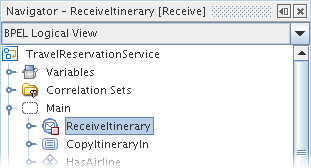
The Toggle Breakpoint pop-up menu command is also available for the elements in the Navigator BPEL Logical View. For the elements with breakpoints, the Navigator shows a small red box (ReceiveItinerary):
-
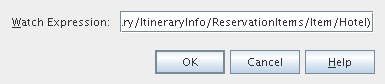
Optionally, you can add watches to monitor XPath expressions. To add a watch, copy the XPath expression you want to monitor, choose Run > Add Watch from the main menu, and paste the expression into the Watch Expression field. Click OK.
Note: You can also add XPath expressions that are not present in the code, but that would be valuable from the debugging point of view.
To start a debugging session on the BPEL Engine:
- In the Projects window, right-click the Composite Applications project you want to debug and choose Debug Project (BPEL) from the pop-up menu.
The IDE establishes a debug session on the BPEL Service Engine. Watch
the BPEL Debugger Console window for confirmation.
The connection might take some time to complete. When it is successfully completed, you can see the new session in the Sessions window and the following messages in the BPEL Debugger Console:
11:35:17 Connecting to localhost:3343
11:36:19 Debug session started
Note that the Debug Project (BPEL) command performs the following actions:
- Enables debugging with the BPEL Service Engine (sets the DebugEnabled property of the BPEL Service Engine to true)
- Builds the Composite Application project and all JBI Modules added to this project
- Deploys the Composite Application project to the BPEL Service Engine
- Starts the debugging session by connecting the BPEL Debugger to the BPEL Service Engine
Therefore, whenever you start a debugging session you can be sure that the latest version of the BPEL process is deployed on the BPEL Service Engine.
Now you can run a test case and monitor the execution of the BPEL process until it stops or reaches a breakpoint. As the process advances, the current context is displayed on the diagram and in the BPEL Process Execution window.
If you have several debugging sessions (you may have a Java debugging session running at the same time) and want to change the current session, double-click the name of this session in the Sessions window. Alternatively, right-click the session you want to make current and select Make current. This session becomes current and the BPEL Process Instances, Watches and BPEL Variables windows are updated to show the data related to the new current session.
When you want to finish a debugging session, open the pop-up menu for the session you want to stop and choose Finish in the Sessions window or select Finish Debugger Session on the toolbar. A message that the debugging session is finished is displayed in the BPEL Debugger Console.
To finish all debugging sessions, in the Sessions window, right-click any session and choose Finish All.
Using Breakpoints to Debug BPEL Processes
Breakpoints are used to instruct the debugger to suspend execution of a process at that place in the source code. When a BPEL process reaches a breakpoint, it becomes suspended and you can perform debugging operations, such as examining the values of variables or stepping into your code.
To view and organize all breakpoints currently set in the IDE, open the Breakpoints window by choosing Windows > Debugging > BPEL > Breakpoints (Alt-Shift-5).
To debug a process instance that has reached a breakpoint:
Once the execution of a process instance is suspended, choose the following commands from the Run menu or on the toolbar:
- Continue (Ctrl-F5). Causes the current process instance to run until
it encounters the next breakpoint or until the instance completes. The state of the instance changes to Running.
- Step Into (F7). Steps to the next BPEL activity. As you step, the current line indicator advances, the current position is highlighted on the diagram, and the contents of
the BPEL Debugger windows change accordingly. The step is
supported only at the granularity of an "activity" in BPEL language terms, not at a finer
granularity.
- Run to Cursor (F4). Runs the BPEL process to the position selected in the Navigator window (BPEL Logical View), on the diagram (in the Design view) or to the cursor location in the Source view. When the location of the cursor is reached, the process instance becomes suspended.
You can remove a breakpoint from the BPEL source code by placing the cursor at the line with the breakpoint and choosing Run > Toggle Breakpoint, or clicking the left margin of the line that contains the breakpoint. Alternatively, on the diagram, you can right-click the element that has a breakpoint and choose Toggle Breakpoint from the pop-up menu.
Monitoring Execution of BPEL Processes
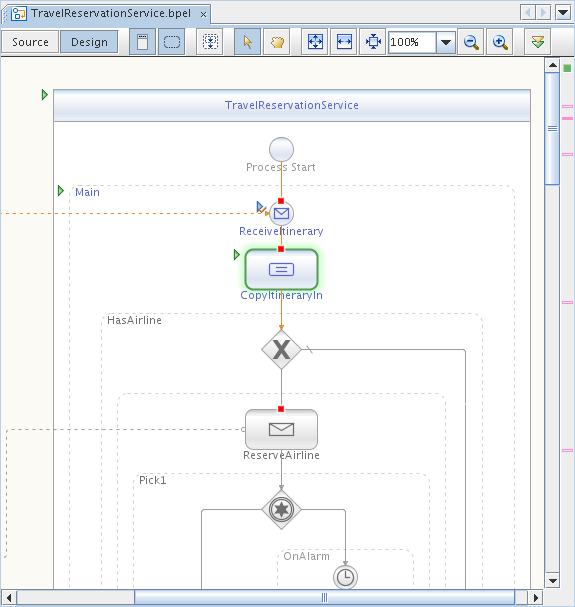
When a running process reaches a breakpoint, the Design view highlights the current position of the debugger and uses colors to differentiate between the states of BPEL activities. As the process advances, the colors and icons for the activities on the diagram are updated to reflect the execution progress.
On the diagram, the following notation is used:
- Green color (glowing). The breakpoint set for the activity is reached.
- Gray color (grayed-out effect). The activity has never been executed.
- Green triangle. The activity is now being executed.
- Blue triangle. The activity has been successfully completed.
You can also monitor the execution of current BPEL process instances in the BPEL Process Execution window (see below).
BPEL Debugger Windows
When a debugging session starts, the IDE displays debugger windows below the IDE editing area. The Sessions, BPEL Process Instances, BPEL Variables, and BPEL Process Execution windows contain information related to BPEL processes running within the current debugging section.
If a debugger window is not displayed, choose Window > Debugging > BPEL > window-name (for example, Window > Debugging > BPEL > BPEL Variables).
The Breakpoints and Watches are standard IDE debugger windows. They display all breakpoints and watches set in the IDE.
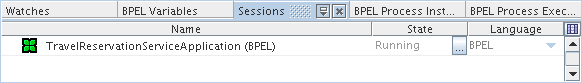
Sessions Window
The Sessions window lists all open debugging sessions, including Java and BPEL debugging sessions. For the BPEL Service Engine, only one session can be started. However, the Sessions window also displays other open debugging sessions, such as Java sessions. Only one of the open debugging sessions can be current, and it is shown in bold. Other debugger windows, such as BPEL Process Instances, BPEL Process Execution, and BPEL Variables, display data related only to the current debugging session.
You can perform the following actions on sessions available in the pop-up menu:
- Make current. Makes the selected session current.
- Finish. Finishes the selected session.
- Finish all. Finishes all debugging sessions.
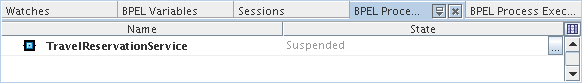
BPEL Process Instances Window
The BPEL Process Instances window lists all BPEL process instances running on the BPEL Service Engine within the current debugging session.
The information displayed for each process instance includes the instance name, unique instance ID, and its state. Process instances can exist in one of the following states:
- Running. The instance is currently being executed on the BPEL Service Engine.
- Suspended. The instance has been suspended for some reason. For example, the process instance has reached a breakpoint.
- Unknown. The status of the instance is unknown.
The following commands are available in the pop-up menu for a process instance:
- Make current. Makes the selected process instance current. The data in other BPEL Debugger windows changes accordingly.
- Resume. Resumes suspended process instances.
- Terminate. Terminates the selected process instance.
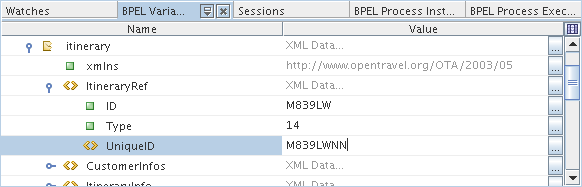
BPEL Variables Window
The BPEL Variables window shows the list of BPEL variables and their values for the current process instance and current position. The current position is a place at which the current process instance became suspended. When you change the current process instance, the records in the BPEL Variables window are updated to reflect the variables for the new current process instance and the new current position.
The structure of local variables is shown as a tree. The information provided for each variable includes the variable name and value.
In the BPEL Variables window you can do the following:
- View the variable structure. To do this, expand the variable node in the tree.
- View and edit the values of variables. To edit the value of a variable, click the ellipsis (...) button and enter the new value in the editor window.
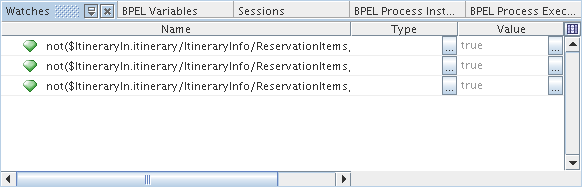
Watches Window
The Watches window shows the list of XPath expressions that you want to monitor. You add watches explicitly before or during the debugging session. The Watches window shows the expression and its value. The value of the expression may change as the process advances depending on the logic of your process.
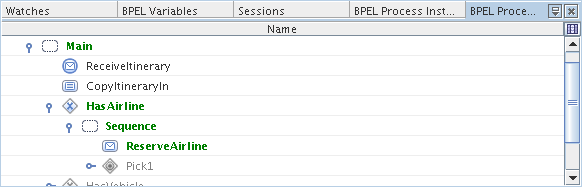
BPEL Process Execution Window
The BPEL Process Execution window graphically represents the progress of executing the current BPEL process instance in the BPEL Debugger. When you change the current process instance, the process tree in the BPEL Process Execution window is updated to reflect the state of the new current process instance and the new current position.
In the BPEL Process Execution window, the following colors are used to display the state of BPEL activities:
- Green. The activity is being executed at the moment.
- Gray. The activity has never been executed.
- Black. The activity has been executed.
Note: In the BPEL Process Execution window, you can only view the progress of executing BPEL processes. You cannot perform any actions in this window.
BPEL Debugger Console Messages
You can see the following messages in the BPEL Debugger Console:
- Connecting to <host>:<port>
- The Debugger is attempting to connect to the BPEL service engine.
- Debug session started
- The Debugger has successfully connected to the BPEL service engine and the debug session has started.
- Unable to start a debug session : Unable to connect to <host>:<port> : Connection timed out: connect
- If you see this message, verify the following:
- The GlassFish V2 Application Server is running.
- The BPEL service engine is started.
- The DebugEnabled property of the BPEL service engine is set to true.
- The host name is the host name of the machine that runs the GlassFish V2 Application Server you are connecting to (localhost by default).
- The port value is the same as the DebugPort property of the BPEL service engine you are connecting to (3343 by default).
- Unable to start a debug session : Already connected to <host>:<port>
- You already have a running debug session attached to this particular service engine.
- Debug session terminated : Target disconnected
- The Debugger lost connection to the server. Check that the server is running and the network is up.
- Stop connecting
- You explicitly terminated the debug session when it was connecting.
- Debug session finished
- You explicitly terminated the debug session when it was running.
top