PE 2.0 » Console » Viewing Reports
← Console: Navigating the Console — Index — Console: Grouping and Classifying Nodes →
Viewing Reports and Inventory Data
When nodes fetch their configurations from the puppet master, they send back inventory data and a report of their run. These end up in the console, where you can view them in that node’s page.
Reading Reports
Graphs
Each node page has a pair of graphs: a histogram showing the number of runs per day and the results of those runs, and a line chart tracking how long each run took.
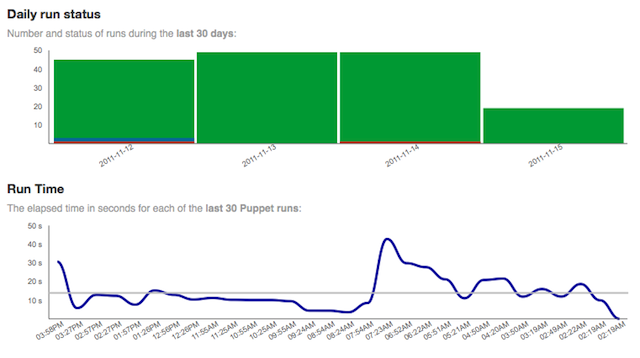
The daily run status histogram is broken down with the same colors that indicate run statuses in the console’s sidebar: red for failed runs, orange for pending runs (where a change would have been made, but the resource to be changed was marked as no-op), blue for successful runs where changes were made, and green for successful runs that did nothing. You can hover over a block of color for a tooltip showing how many runs of that type occurred:
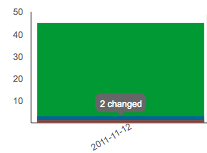
Note: Run status histograms also appear on group pages, class pages, and run status pages.
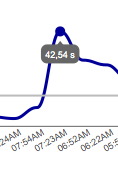
The run time chart graphs how long each of the last 30 Puppet runs took to complete. A longer run usually means changes were made, but could also indicate heavy server load or some other circumstance. You can hover over a point on the line for a tooltip showing the number of seconds it represents:
Normal Reports
Each node page has a short list of recent reports, with a “more” button at the bottom for viewing older reports:
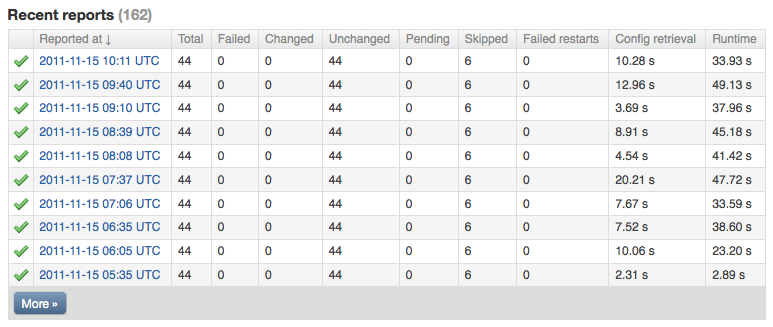
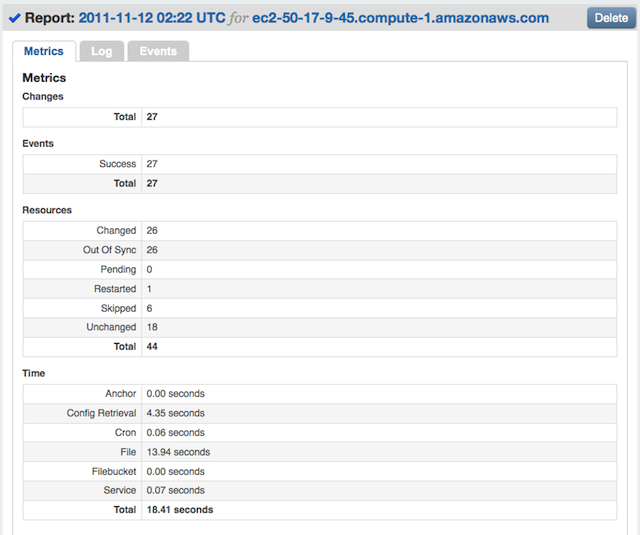
Each report represents a single Puppet run. Clicking a report will take you to a tabbed view that splits the report up into metrics, log, and events.
Metrics is a rough summary of what happened during the run, with resource totals and the time spent retrieving the configuration and acting on each resource type.
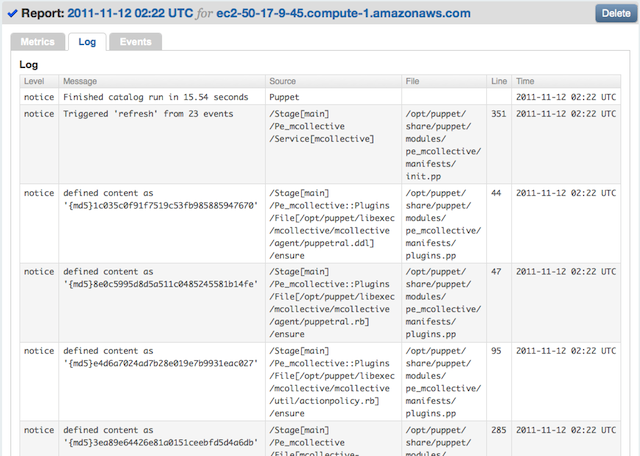
Log is a table of all the messages logged during the run.
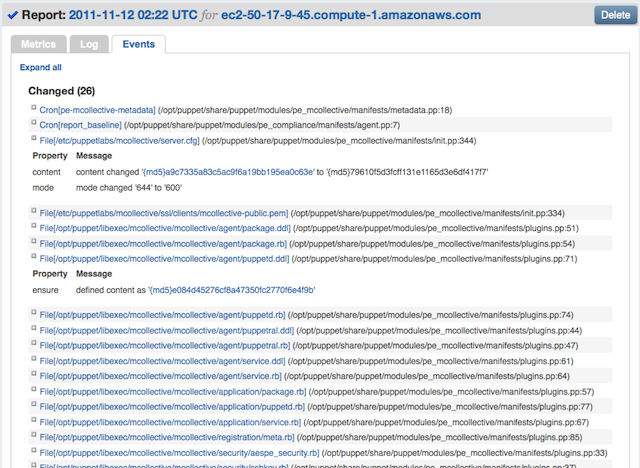
Events is a list of the resources the run managed, sorted by whether any changes were made. You can click on a changed resource to see which attributes were modified.
Viewing Inventory Data
Each node’s page has a section called inventory. This section contains all of the fact values reported by the node on its most recent run.
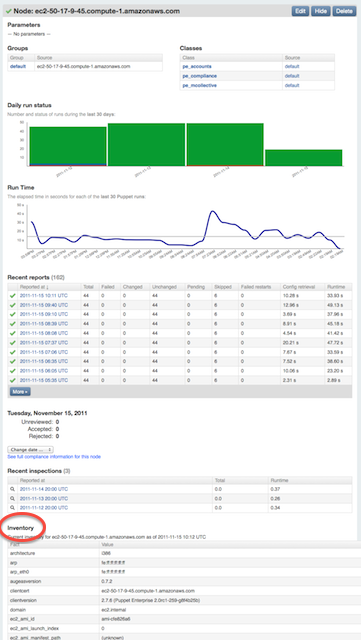
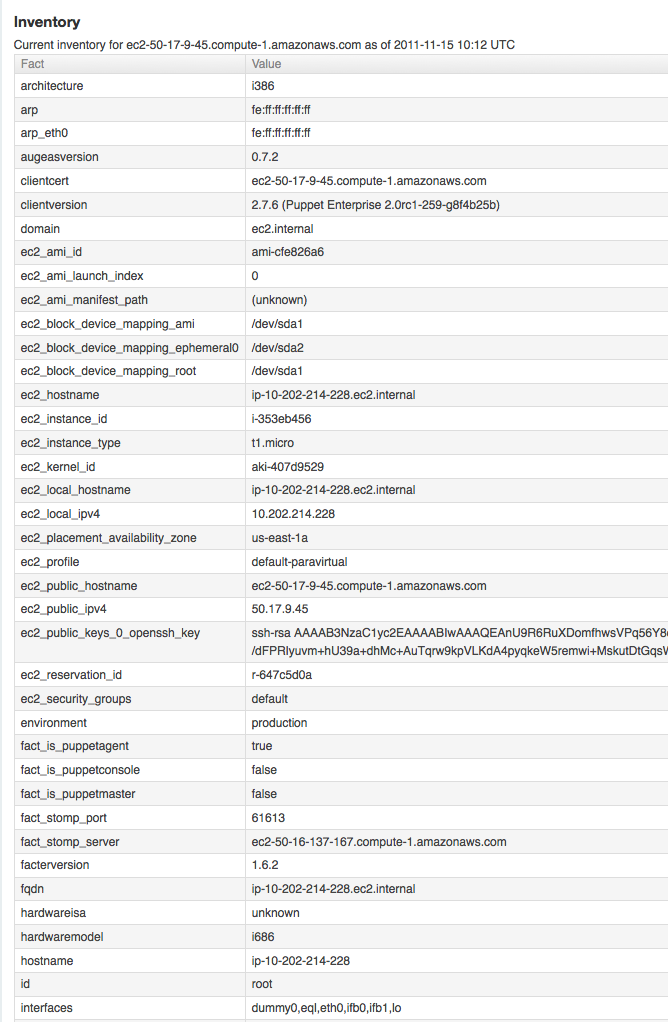
Facts include things like the operating system (operatingsystem), the amount of memory (memorytotal), and the primary IP address (ipaddress). You can also add arbitrary custom facts to your Puppet modules, and they too will show up in the inventory.
The facts you see in the inventory can be useful when filtering nodes in the live management page.
Searching by Fact
Use the “inventory search” page to find a list of nodes with a certain fact value.
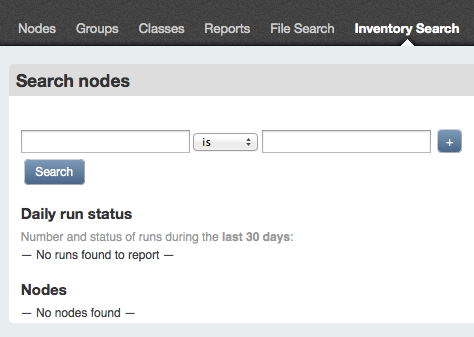
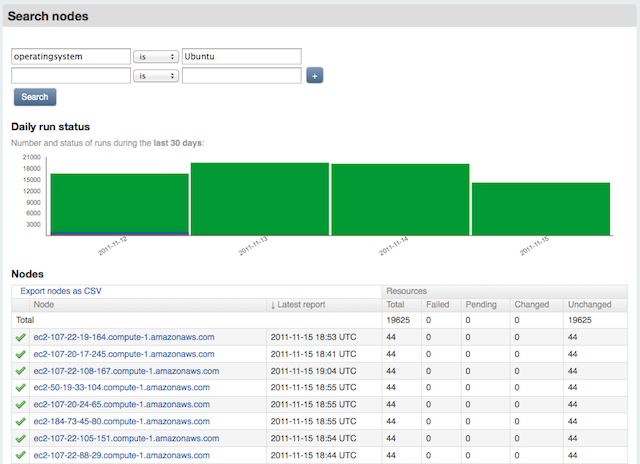
You can add more facts to filter the search results further, and can change the comparison criteria for each one.
← Console: Navigating the Console — Index — Console: Grouping and Classifying Nodes →