

|
|
|
The Log Transaction Display screen appears when you select Transactions from the Log Info Menu screen.
This screen contains an entry for each transaction in the logging system.
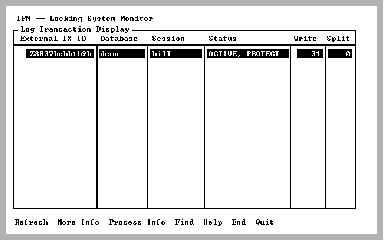
This screen lets you observe the activity of each transaction and pinpoint those transactions that are generating extensive logging system activity. The status of each transaction is also displayed. You can use the Find menu item to search for FORCE_ABORT transactions by tabbing to the Status column and selecting Find.
The Process_Info menu item allows monitoring of the process to which the selected transaction belongs. For example, in multi-server installations, it is not necessary to determine to which server a transaction belongs. Place the cursor on the desired transaction and select the Process_Info menu item. The Detailed Process Information Screen (VMS Only) is displayed.
Once a transaction is committed, it is no longer in the logging system. When this screen is refreshed, the transaction disappears from the display if it was committed between the last screen refresh and the current time. Transactions that have been committed and not yet journaled (and when fast commit is on) appear with a status of INACTIVE. By default, INACTIVE transactions are not displayed. The -i option or the Display inactive transactions field on the Options Display screen can be set to "y" to force display of inactive transactions.
|
|
|
The columns of information on the Log Transaction Display screen are:
The Transaction ID. This column corresponds to the Transaction ID field on the More_Info pop-up screen for the Lock List display. For more information, see Lock List Display Screen.
The name of the database in which this transaction is running
The session name running this transaction. Session names beginning with $ are internal transactions.
The status of the transaction. Valid statuses are as follows:
Active. User transactions are usually in this state. No commit has been issued.
The transaction is a slave transaction of a larger distributed transaction.
The transaction is being rolled out because the log file reached the FORCE_ABORT limit.
Not Active. Internal transactions are usually in this state.
The distributed transaction was manually rolled out.
The distributed transaction was manually committed.
The transaction cannot be aborted due to FORCE_ABORT or LOG_FILE_FULL. Distributed transactions have this status.
The transaction must be recoverable. User transactions always have this status.
The transaction's connection to the master coordinating application has been lost and the transaction is awaiting reconnection in order to close the transaction.
The transaction has been taken over by the recovery process.
The server to which this transaction belongs is aborting that transaction.
The transaction is being rolled out because the session owning this transaction has requested the abort.
The transaction is ready to commit. This applies to distributed transactions only.
The number of log file write requests made by this transaction
The number of times a write to the log file was split across more than one log file page and there was not a free buffer. If this occurs frequently, the number or size of the log buffers must be increased to prevent throughput problems to the log file.
|
|
|
The menu items available on this screen are:
Queries the logging system for logging information. Process, database, and transaction information are obtained together to ensure a consistent snapshot of the logging system.
Place the cursor on the desired transaction and select this menu item. Additional information for that transaction is displayed, including the first and last page address in the log file for this transaction.
For more information on this screen, see Log Transaction Display More_Info Screen.
VMS:
Displays the Detailed Process Information screen. This screen shows various job-process information for the process on which the cursor is positioned. Such information includes CPU time, Direct I/O, Buffered I/O, Enqueue limit, etc. This display automatically refreshes.
For more information on this screen, see Detailed Process Information Screen (VMS Only). 
Searches any column in the scrolling area. To initiate the search, tab to the desired column and select Find. If you are searching a text column, Find locates all occurrences in the column.
Displays help screens
Returns to the Log Info Menu screen
Exits IPM
|
|
|
When the More_Info menu item is selected from the Log Transaction Display screen, a pop-up screen containing additional fields for the specified transaction is displayed.
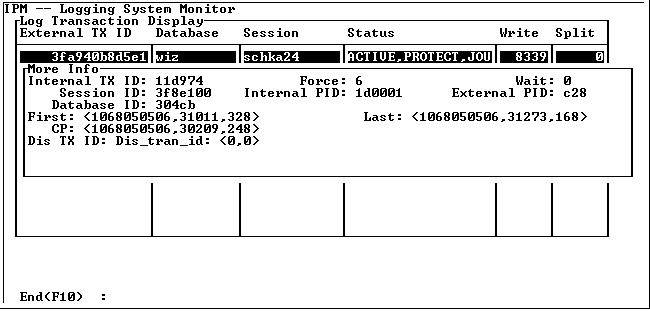
The pop-up has the following fields:
The internal transaction ID used by the logging system
Indicates how many times this transaction has caused a log buffer to be forced to the log file
The number of times this transaction had to wait to use the logging system
The session ID of the session that owns this transaction. This ID corresponds to the ID column on the Session List screen. For more information, see Session List Screen.
The internal process ID (PID) used by the logging system for the process to which this transaction belongs. This field corresponds to the ID column on the Log Process display. For more information, see Log Process Display Screen.
The operating system PID for the process to which this transaction belongs. This field corresponds to the PID column on the Log Process display. For more information, see Log Process Display Screen.
The internal database ID used by the logging system. This field corresponds to the ID field on the More_Info pop-up screen for the Log Database display. For more information, see Log Database Display Screen.
The distributed transaction ID to which this transaction belongs
The log file address (position in the log file) for the begin transaction marker for this transaction. It is possible to determine the oldest transaction by viewing the middle number of this field.
The log file address (position in the log file) for the last record written to the log file
The log file address (position in the log file) where a consistency point is taken