
")

The Fuse perspective, shown in Figure 10.1, is where you access the Fuse IDE debugging tools.
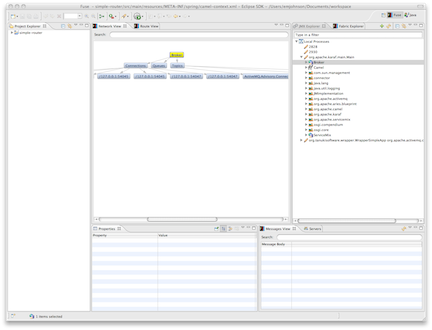
The Fuse perspective consists of five main areas:
JMX Explorer—lists the JMX servers and the infrastructure they monitor
Diagram View—provides a visual representation of the item selected in the JMX Explorer
Messages View—lists the messages that have passed through the selected JMS destination or Apache Camel endpoint
Servers—lists the Fuse ESB, Apache Karaf, or Apache ServiceMix containers deployed into your Fuse IDE environment
Properties—displays the properties of the selected item
The JMX Explorer drives most of the activities in the Fuse IDE perspective. It determines what routes are displayed in the Diagram View, the property viewer, and the Messages View. It is also provides menu commands for activating route tracing, adding and deleting JMS destinations, and starting and stopping routes. It is also the target for dragging and dropping messages.
By default, the JMX Explorer shows all of the Java processes running on your local machine. You can add JMX servers as needed to view infrastructure on other machines.
The Messages View is used for JMS browsing and route tracing.
When a JMS destination is selected in the JMX Explorer, the view lists all of the messages sitting in the destination.
When a browsable Apache Camel endpoint is selected and route tracing has been activated, the view lists all of the messages that have passed through the endpoint since tracing was activated.
When a message in the Messages View is selected, its details are displayed in the Property tab. The message details include all of the message's headers and the message's body.
 |  |  |
 |
