Control Center System Requirements
This section is not an exhaustive guide to running Control Center in production, but it covers the key things to consider before going live.
Hardware
As of this release, Control Center must run on a single machine. The resources needed for this machine depend primarily on how many producers are monitored and how many partitions each producer writes to. The Stream Monitoring functionality of Control Center is implemented as a Kafka Streams application and consequently benefits from having a lot of memory to work with for RocksDB caches and OS page cache.
Memory
The more memory you give Control Center the better but we recommend at least 32 GB of RAM. The JVM heap size can be fairly small (defaults to 6 GB) but the application needs the additional memory for RocksDB in-memory indexes and caches as well as OS page cache for faster access to persistent data.
CPUs
The Stream Monitoring functionality of Control Center requires significant CPU power for data verification and aggregation. We recommend at least 8 cores. If you have more cores available, you can increase the number of threads in the Kafka Streams pool (confluent.controlcenter.streams.num.stream.threads) and increase the number of partitions on internal Control Center topics (confluent.controlcenter.internal.topics.partitions) for greater parallelism.
Disks
Control Center relies on local state in RocksDB. We recommend at least 300 GB of storage space, preferably SSDs. All local data is kept in the directory specified by the confluent.controlcenter.data.dir config parameter.
Network
Control Center relies heavily on Kafka, so fast and reliable network is important for performance. Modern data-center networking (1 GbE, 10 GbE) should be sufficient.
OS
Control Center needs many open RocksDB files. Make sure the ulimit for the number of open files (ulimit -n) is at least 16384.
JVM
We recommend running the latest version of JDK 1.8 with a 6 GB max heap size. JDK 1.7 is also supported.
User/Cluster Metadata
Control Center stores cluster metadata and user data (triggers/actions) in the _confluent-command topic.
This topic is not changed during an upgrade. To reset it, change the confluent.controlcenter.command.topic config
to something else (e.g. _confluent-command-2) and restart Control Center,
this will re-index the cluster metadata and remove all triggers/actions
Kafka
The amount of storage space needed in Kafka depends on how many producers and consumers are being monitored as well as the configured retention and replication settings.
By default, Control Center keeps 3 days worth of data for the monitoring topic _confluent-monitoring and metrics topic _confluent-metrics,
and 24 hours of data of all of it’s internal topics.
This means that you can take Control Center down for maintenance for as long as 24 hours without data loss.
You can change these values by setting the following config parameters
confluent.monitoring.interceptor.topic.retention.msconfluent.metrics.topic.retention.msconfluent.controlcenter.internal.topics.retention.ms
Control Center also has a number of internal topics that it uses for aggregations. Data on these topics is kept with different retention periods based on the data type.
- Streams Monitoring data is held at two retention levels, 96 hours for granular data, and 700 days for historical data. For example, if you have the same number of clients reading and writing granular data from the same number of topics, the amount of space that is required is about twice the amount needed for running at 96 hours.
- Metrics data has a retention period of 7 days. With a constant number of topic partitions in a cluster, the amount of data that is used for metrics data should grow linearly and max out after 7 days of accumulation.
By default, Control Center stores 3 copies on all topic partitions for availability and fault tolerance.
The full set of configuration options are documented in Configuring Control Center.
Multi-Cluster Configuration
You can use Control Center to monitor multiple Kafka Clusters. All metric data from the interceptors and metrics reporters is tagged by Kafka cluster ID and aggregated in Control Center by cluster ID. The cluster ID is randomly generated by Apache Kafka, but you can assign meaningful names using Control Center.
To monitor multiple clusters with Control Center, you must have the following prerequisites:
- Control Center must be installed.
- Multiple Kafka clusters must be already running. You cannot deploy new clusters with Control Center. This will be added in a future release of Control Center.
There are two basic methods for configuring the interceptor and metrics reporter plugins in multi-cluster environments: direct and replicated.
With either method, you install a single Control Center server and connect to a Kafka cluster. This cluster acts as the storage and coordinator for Control Center.
- Direct: Using the direct method, the plugins will report the data directly to the Control Center cluster. If your network topology allows direct communication from interceptors and metrics reporters to Control Center, the direct method is the recommended solution.
- Replicated: Using the replicated method, the plugins will report data to a local Kafka cluster that they have access to. A replicator process will copy the data to the Control Center cluster. For more information, see the Replicator quickstart. The replicated configuration is simpler to use when deploying interceptors, because they will report to the local cluster by default. Use this setup if you have a network topology that prevents Control Center plugins from communicating directly with the Control Center cluster, or if you are already using Replicator and you are familiar with its operations.
Direct
You can configure interceptors to send metrics data directly to the Control Center Kafka cluster. This cluster might be separate from the Kafka cluster that the Client being monitored is connected to.
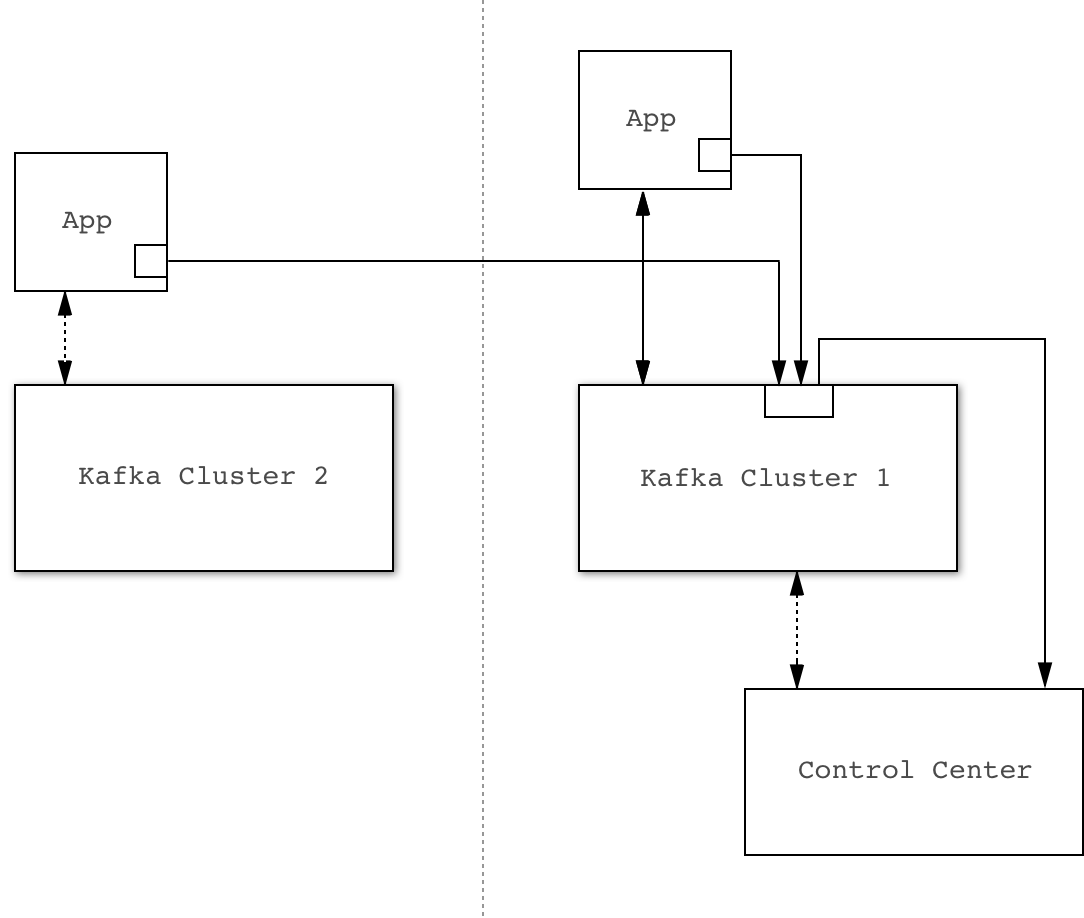
Example direct configuration. Solid lines indicate flow of interceptor data.
The primary advantage of this method is its robust protection against availability issues with the cluster being monitored.
The primary disadvantage is that every Kafka client must be configured with the Control Center Kafka cluster connection parameters. This could potentially be more time consuming, particularly if Security is enabled.
Here is an example configuration for a client:
bootstrap.servers=kafka-cluster-1:9092 # this is the cluster your clients are talking to
confluent.monitoring.interceptor.bootstrap.servers=kafka-cluster-2:9092 # this is the |c3-short| cluster
Replicated
By default, interceptors and metric reporters send metric data to the same Kafka cluster they are monitoring. You can
use Confluent Replicator to transfer and merge this data into the Kafka Cluster that
is used by Control Center. The _confluent-monitoring and _confluent-metrics topics must be replicated to the Control Center cluster.
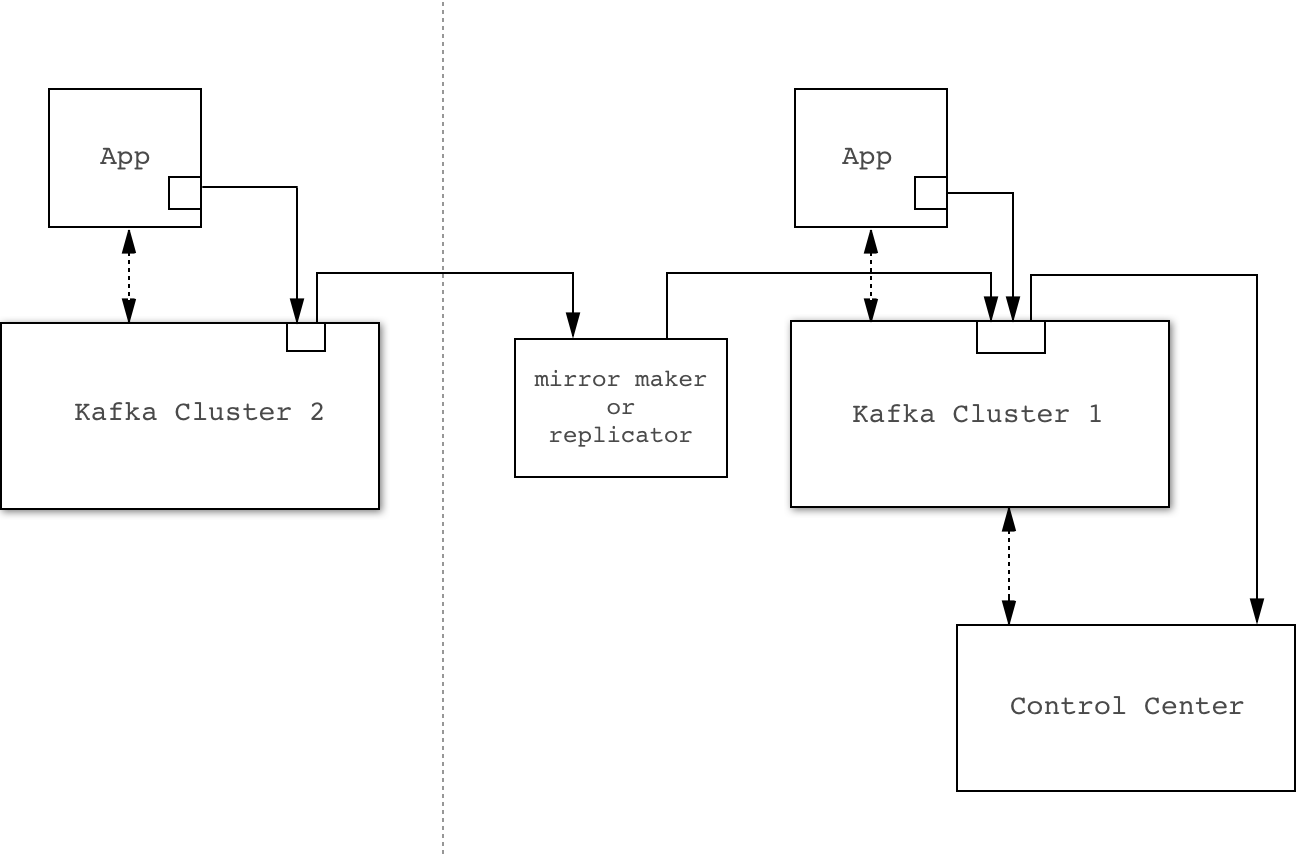
Example replicated configuration. Solid lines indicate flow of interceptor and cluster data.
Dedicated Metric Data Cluster
You can send your monitoring data to an existing Kafka cluster or configure a dedicated cluster for this purpose.
Here are the advantages to giving Control Center its own Kafka cluster:
- By hosting Control Center on its own Kafka Cluster, it is independent of the availability of the production cluster it is monitoring. For example, if there are severe production issues, you will continue to receive alerts and be able to view the Control Center monitoring information. A production disaster is when you need these metrics the most.
- Ease of upgrade. Future versions of Control Center are likely to take advantage of new features of Kafka. If you use a separate Kafka cluster for Control Center, it may be easier for you to take advantage of new features in future versions of Control Center if the upgrade path does not involve any production Kafka cluster.
- The cluster may have reduced security requirements that could make it easier to implement the direct strategy described.
- The Control Center requires a significant amount of disk space and throughput for metrics collection. By giving Control Center its own dedicated cluster, you guarantee that Control Center workload will never interfere with production traffic.
Here are the disadvantages of giving Control Center its own Kafka cluster:
- A dedicated cluster requires additional hardware (virtual or physical), setup, and maintenance.
- Control Center only shows topic descriptions for topics that are on the cluster it is using for storage. Future versions will include topic descriptions from other clusters as well. This means that the “Topic Management” view in the web interface shows less information if Control Center is running on a dedicated cluster. This will be fixed in a future release of Control Center.
- If Control Center uses a dedicated cluster, it probably cannot be used to manage Connectors. This will be fixed in a future release of Control Center.
Example Deployments
Here are some example Control Center setup we tested internally.
Broker Monitoring
- Given:
- 1 Confluent Control Center (running on EC2 m4.2xlarge)
- 3 Kafka Brokers
- 1 ZooKeeper
- 200 Topics
- 10 Partitions per Topic
- 3x Replication Factor
- Default JVM settings
- Default Control Center config
- Default Kafka config
- Expect:
- Control Center state store size ~50MB/hr
- Kafka log size ~500MB/hr (per broker)
- Average CPU load ~7 %
- Allocated java on-heap memory ~580 MB and off-heap ~100 MB
- Total allocated memory including page cache ~3.6 GB
- Network read utilization ~150 KB/sec
- Network write utilization ~170 KB/sec
Streams Monitoring
- Given:
- 1 Confluent Control Center (running on EC2 m4.2xlarge)
- 3 Kafka Brokers
- 1 ZooKeeper
- 30 Topics
- 10 Partitions per Topic
- 150 Consumers
- 50 Consumer Groups
- 3x Replication Factor
- Default JVM settings
- Default Control Center config
- Default Kafka config
- Expect:
- Control Center state store size ~1 GB/hr
- Kafka log size ~1 GB/hr (per broker)
- Average CPU load ~8 %
- Allocated java on-heap memory ~600 MB and off-heap ~100 MB
- Total allocated memory including page cache ~4 GB
- Network read utilization ~160 KB/sec
- Network write utilization ~180 KB/sec