- Introduction
- 1. Overview
- 2. Getting Started
- 3. Developing Microservices
- 4. Developer Reference
- 5. Microservices Platform
- 6. Integration
- 7. Quickstarts
-
8.
Tools
- 8.1. Forge
-
8.2.
Maven Plugin
-
8.2.1.
Old 2.x plugin
- 8.2.1.1. fabric8:migrate
- 8.2.1.2. docker:build
- 8.2.1.3. docker:push
- 8.2.1.4. fabric8:apply
- 8.2.1.5. fabric8:create-env
- 8.2.1.6. fabric8:create-routes
- 8.2.1.7. fabric8:delete-pods
- 8.2.1.8. fabric8:devops
- 8.2.1.9. fabric8:helm
- 8.2.1.10. fabric8:helm-push
- 8.2.1.11. fabric8:json
- 8.2.1.12. fabric8:recreate
- 8.2.1.13. fabric8:rolling
-
8.2.1.
Old 2.x plugin
- 8.3. Helm
- 9. Annotations
- 10. Architecture
- 11. Source Code
- 12. Changes from V1
- 13. FAQ
-
14.
Other Install Options
- 14.1. Kubernetes
- 14.2. OpenShift
- Published with GitBook
Logging
Logging is a key part of being able to understand and diagnose distributed systems. Consolidating log statements and events and being able to query and visualise them is an extremely useful tool.
With fabric8 we recommend using:
- Elasticsearch as the back end storage of logs and events in your system as its easy to scale, provides replicated data for resilience and is very easy to query using complex structural and textual queries
- Kibana as the console to view, query and analyze the logs
- fluentd for automated log spooling from Docker containers directly to Elasticsearch
Using Elasticsearch on Kubernetes makes it easy to scale the ES cluster on the server side as well as discover the cluster for clients using Kubernetes Services.
How to use Logging in fabric8
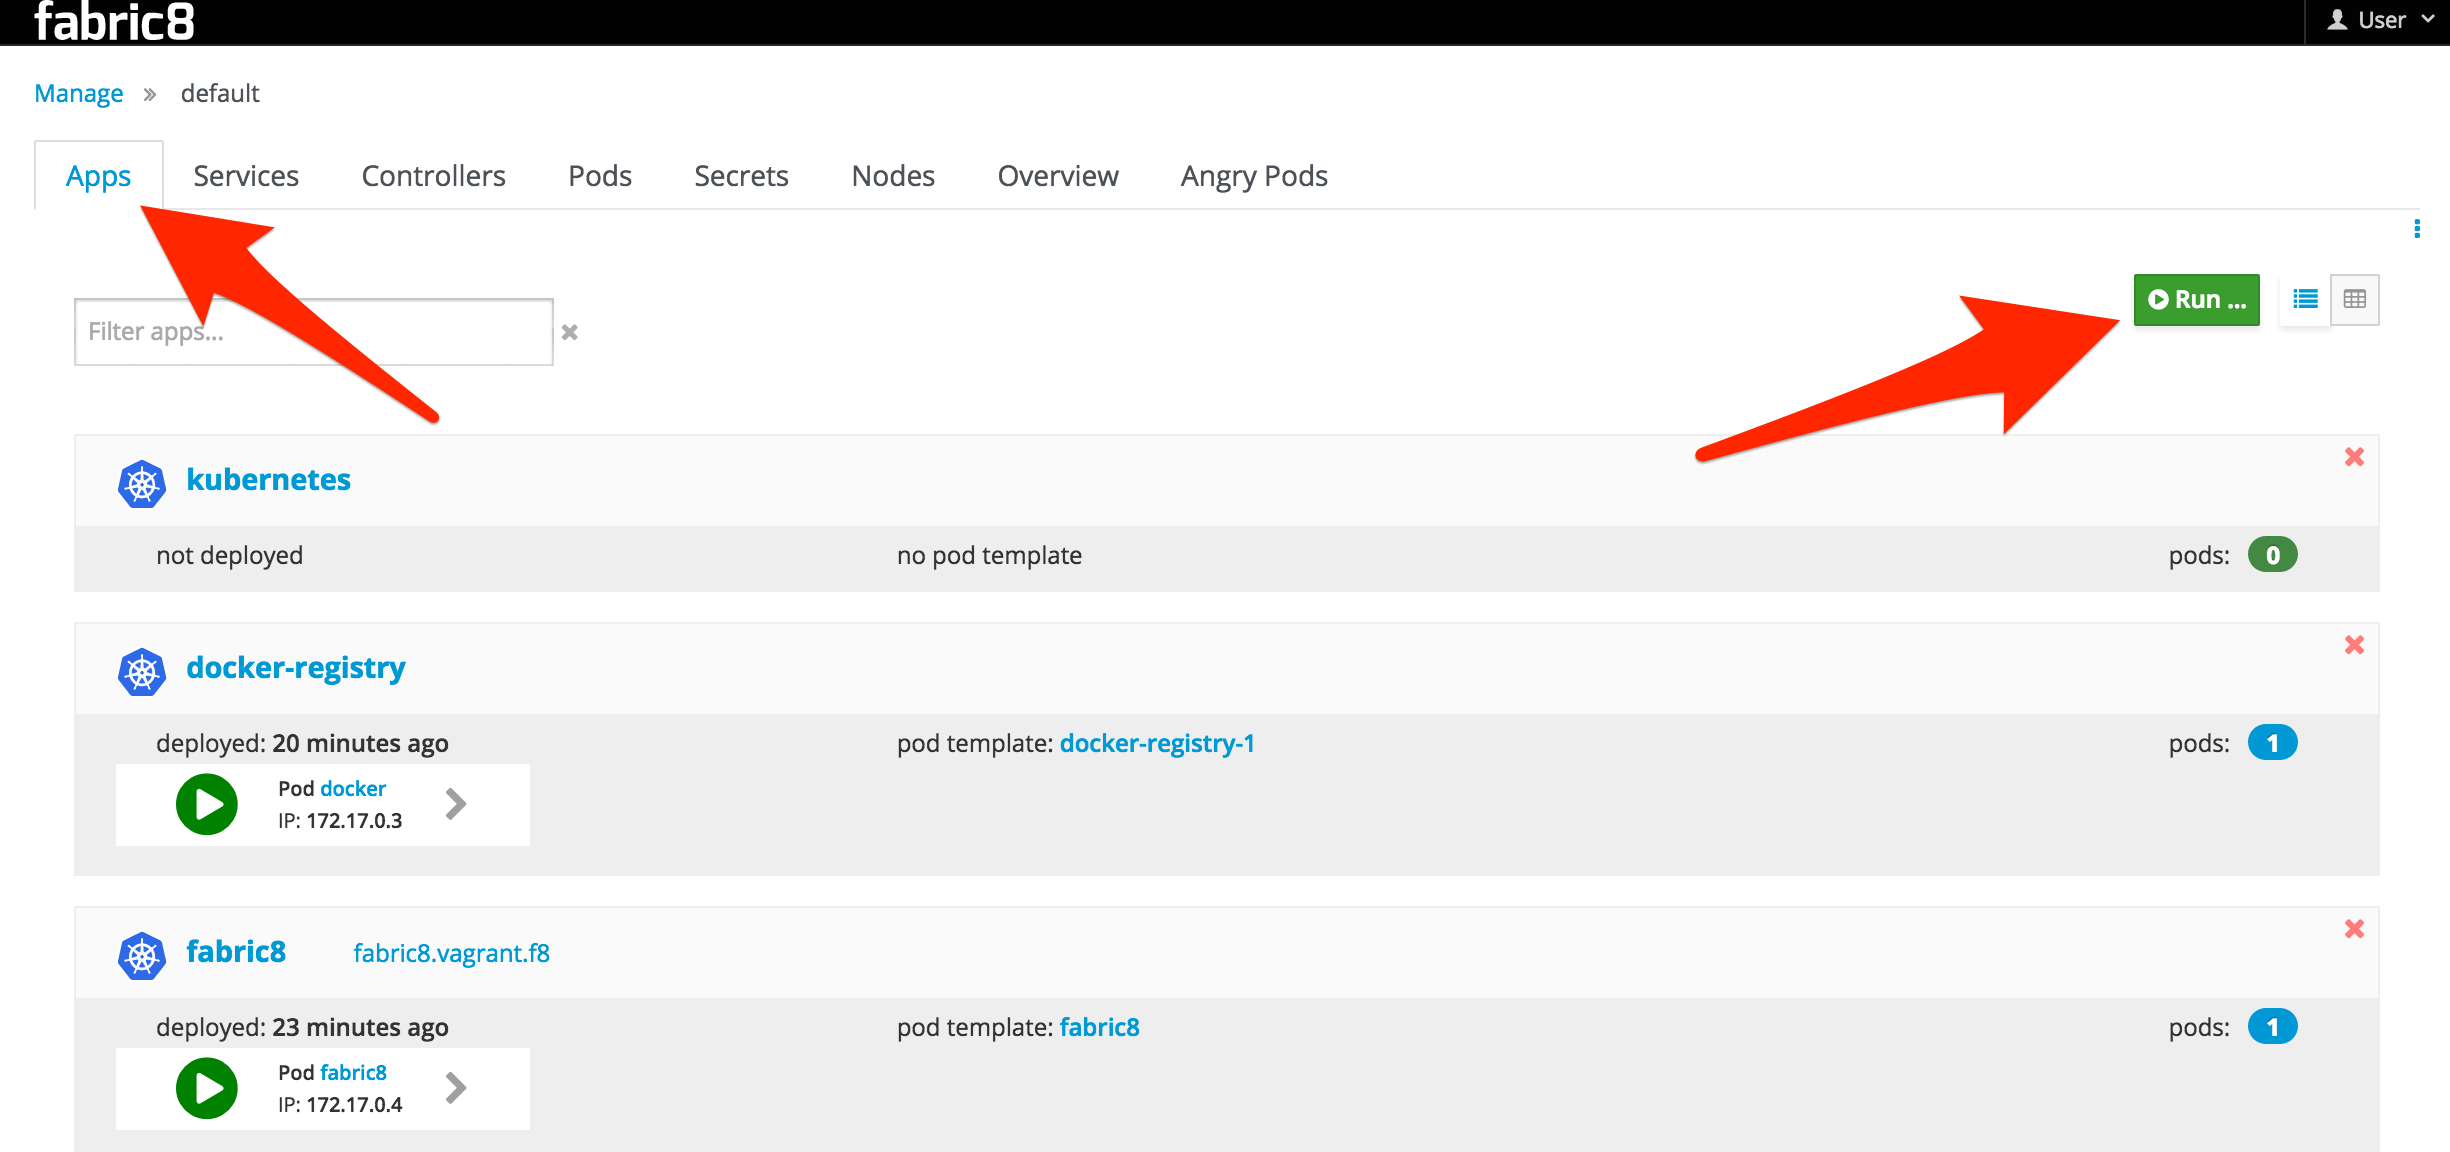
If you are running Fabric8 with the Fabric8 Console then go to the Apps tab and click Run:
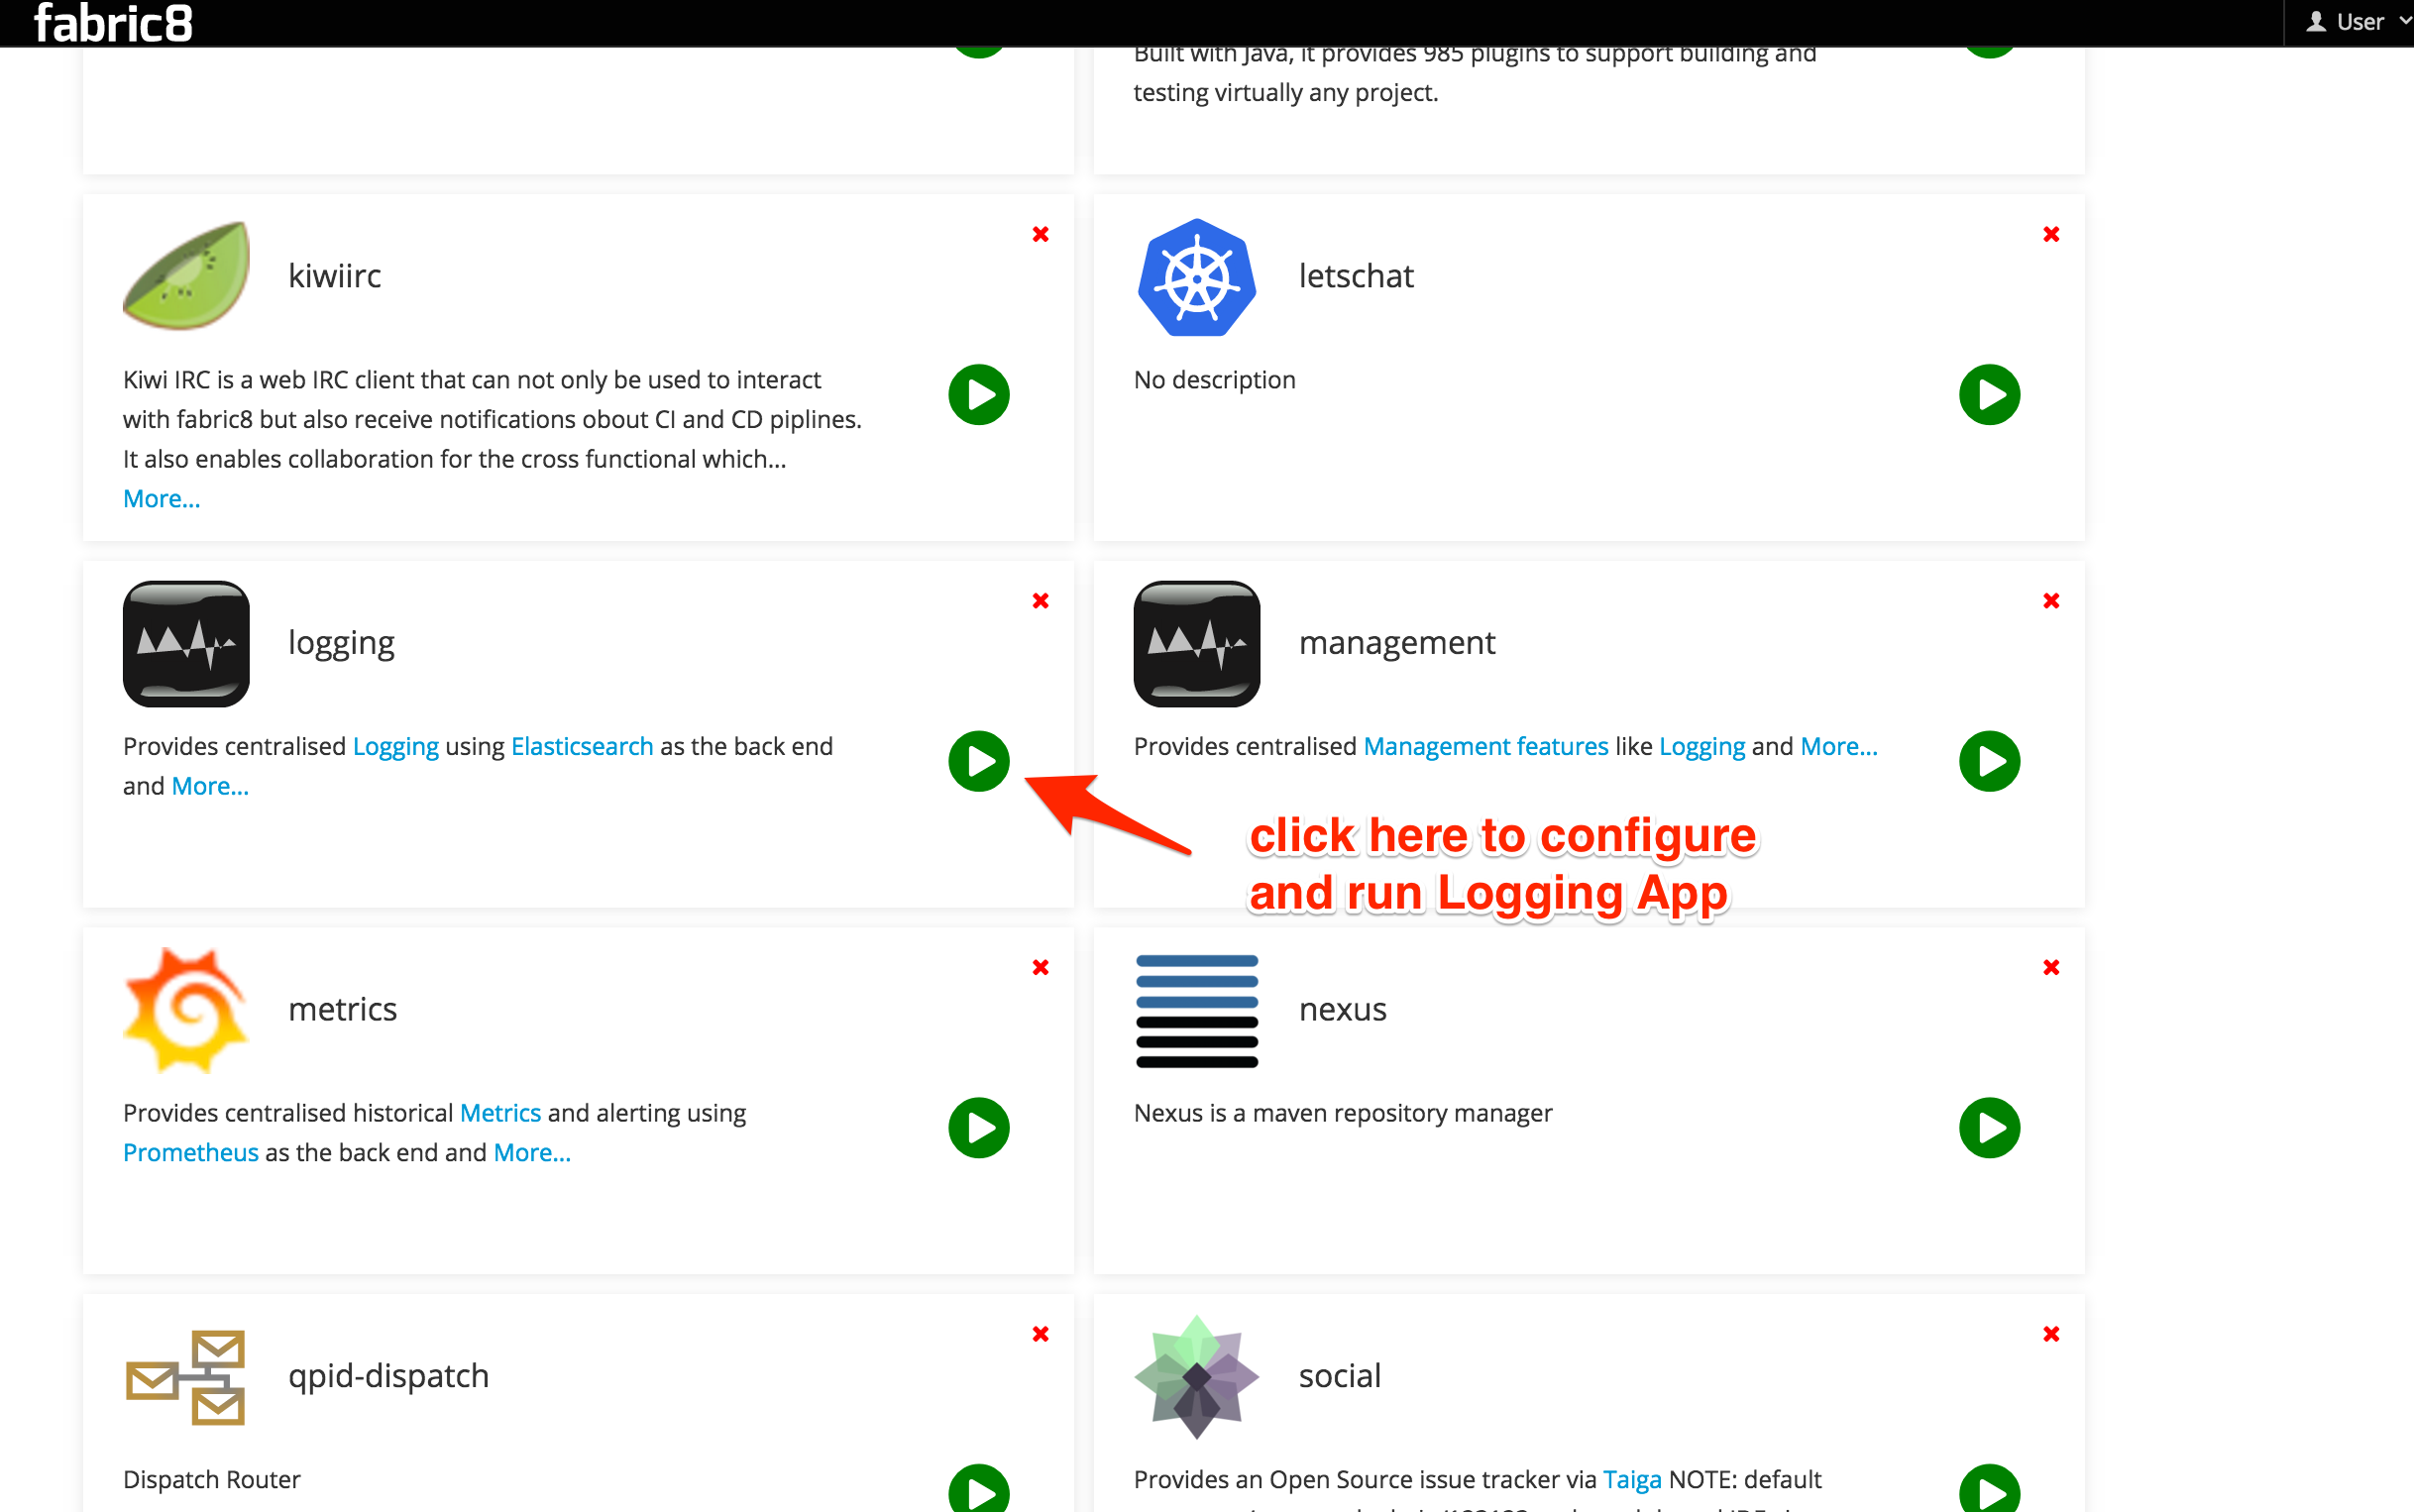
Then click on the "Logging" App. You can then enter the base domain name for your Kubernetes/OpenShift cluster for the Route host name suffix field (this will generate an OpenShift route for you. We are working generating the Kubernetes Ingress definition for vanilla Kube #5567). You can optionally turn this off by clicking the checkbox. This should install Elasticsearch Master nodes and the Kibana UI as Kubernetes pods and fluentd as a Kubernetes Daemon set. It will also set up Kubernetes replication controllers and Services for you. For example, if your base Kubernetes cluster is at vagrant.f8 then the App will be set up with services at kibana.vagrant.f8 and elasticsearch.vagrant.f8.
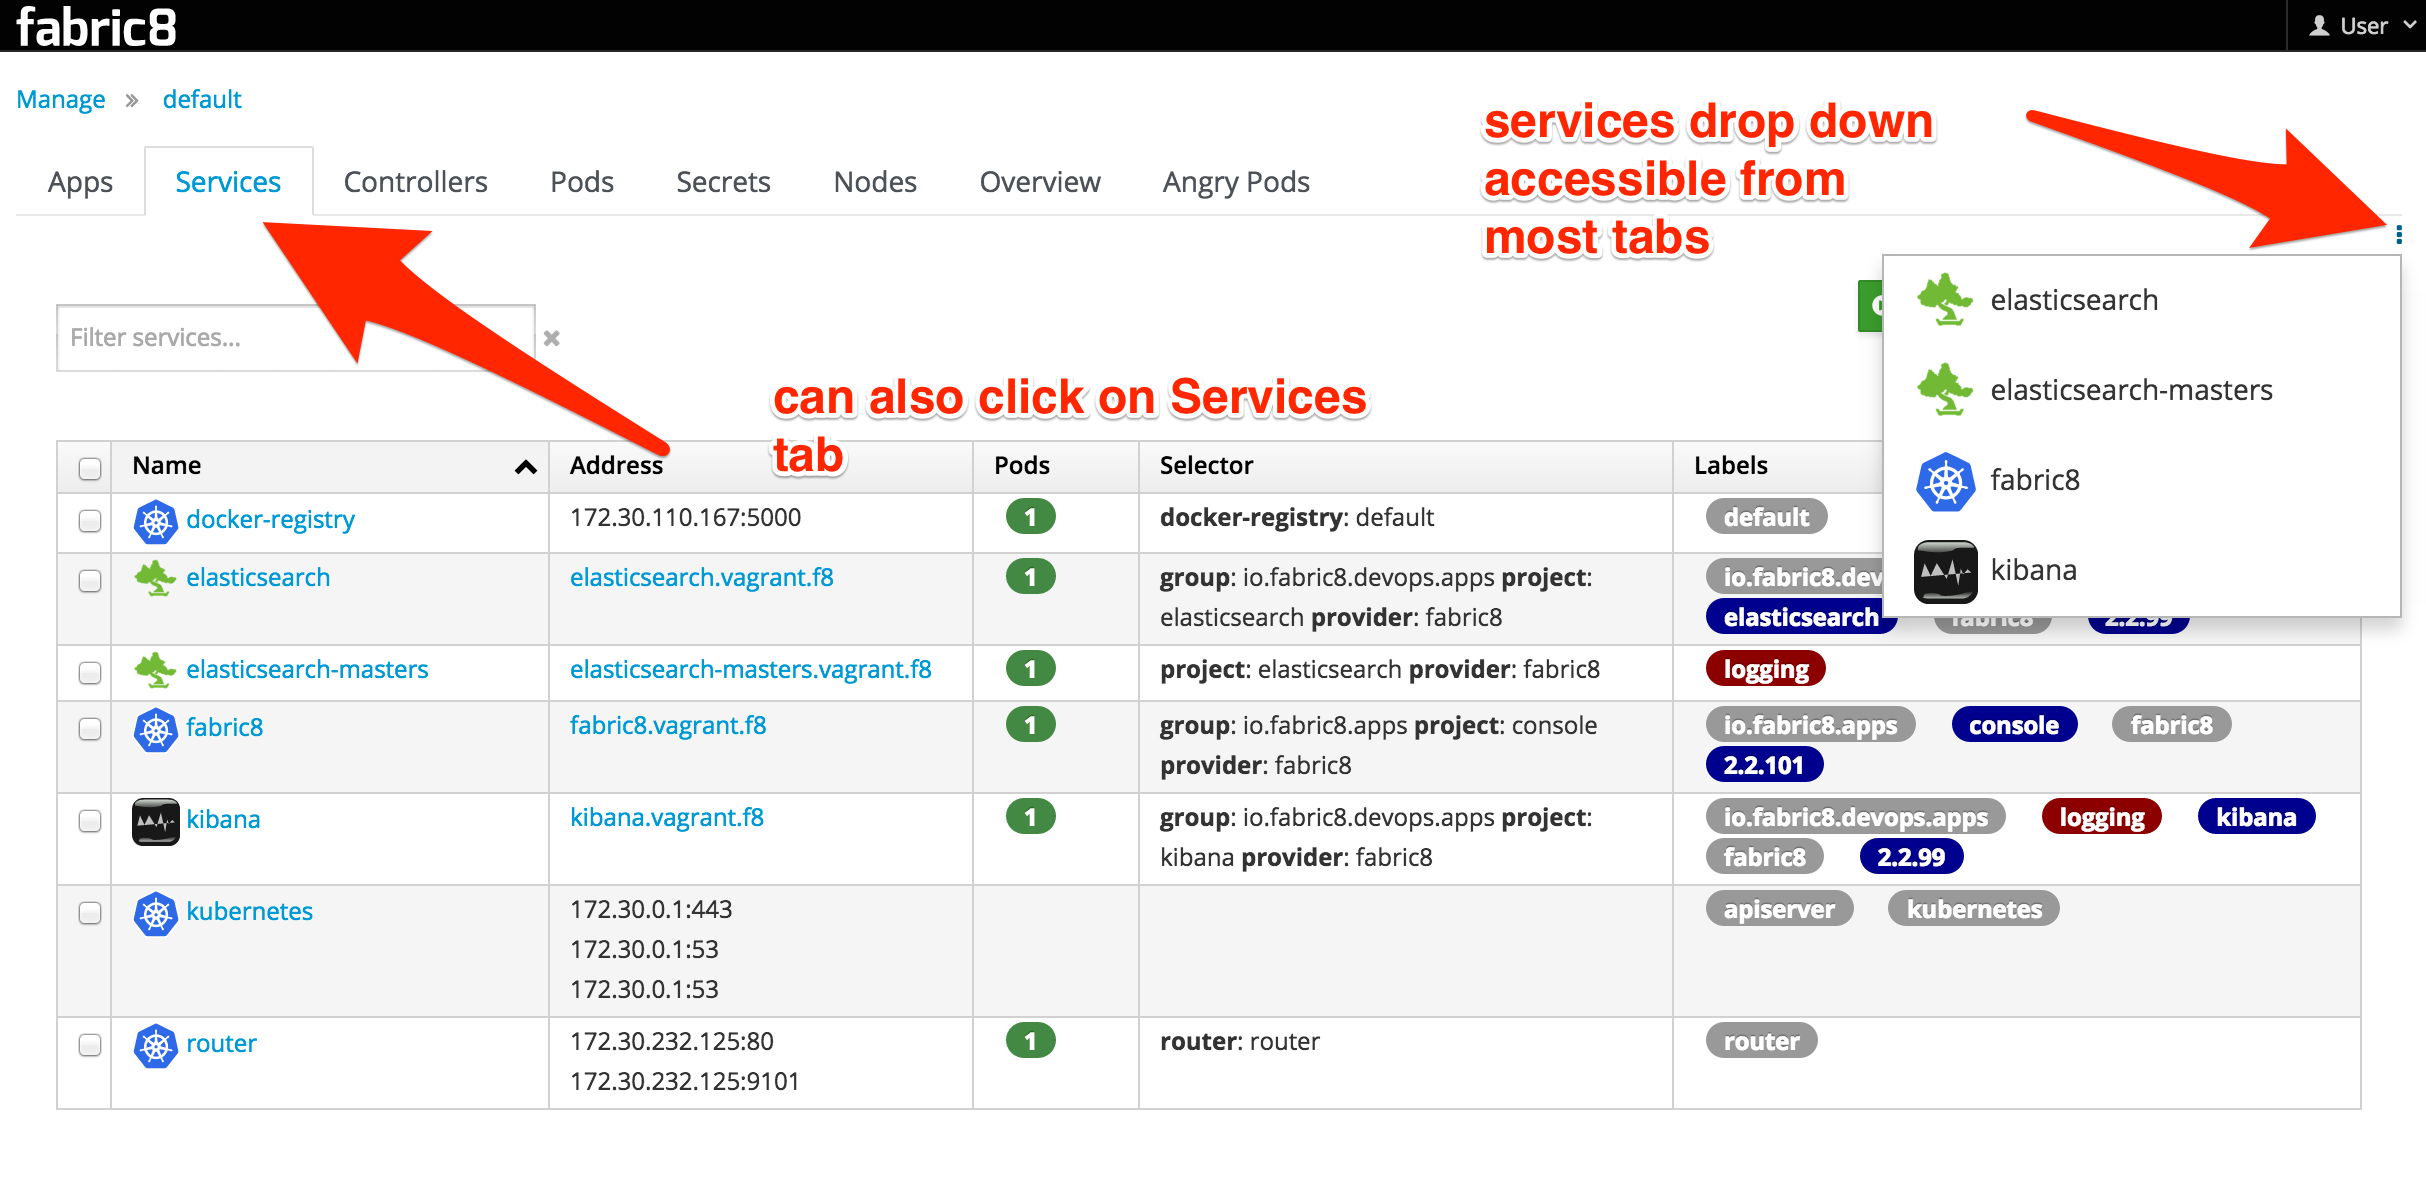
Once the Logging App is running (watch the pods start up in the fabric8 console!) you can find the service you'd like to access and navigate to it. You can do this by selecting the Services tab, or the little vertical ellipses that has a Services drop-down chooser: