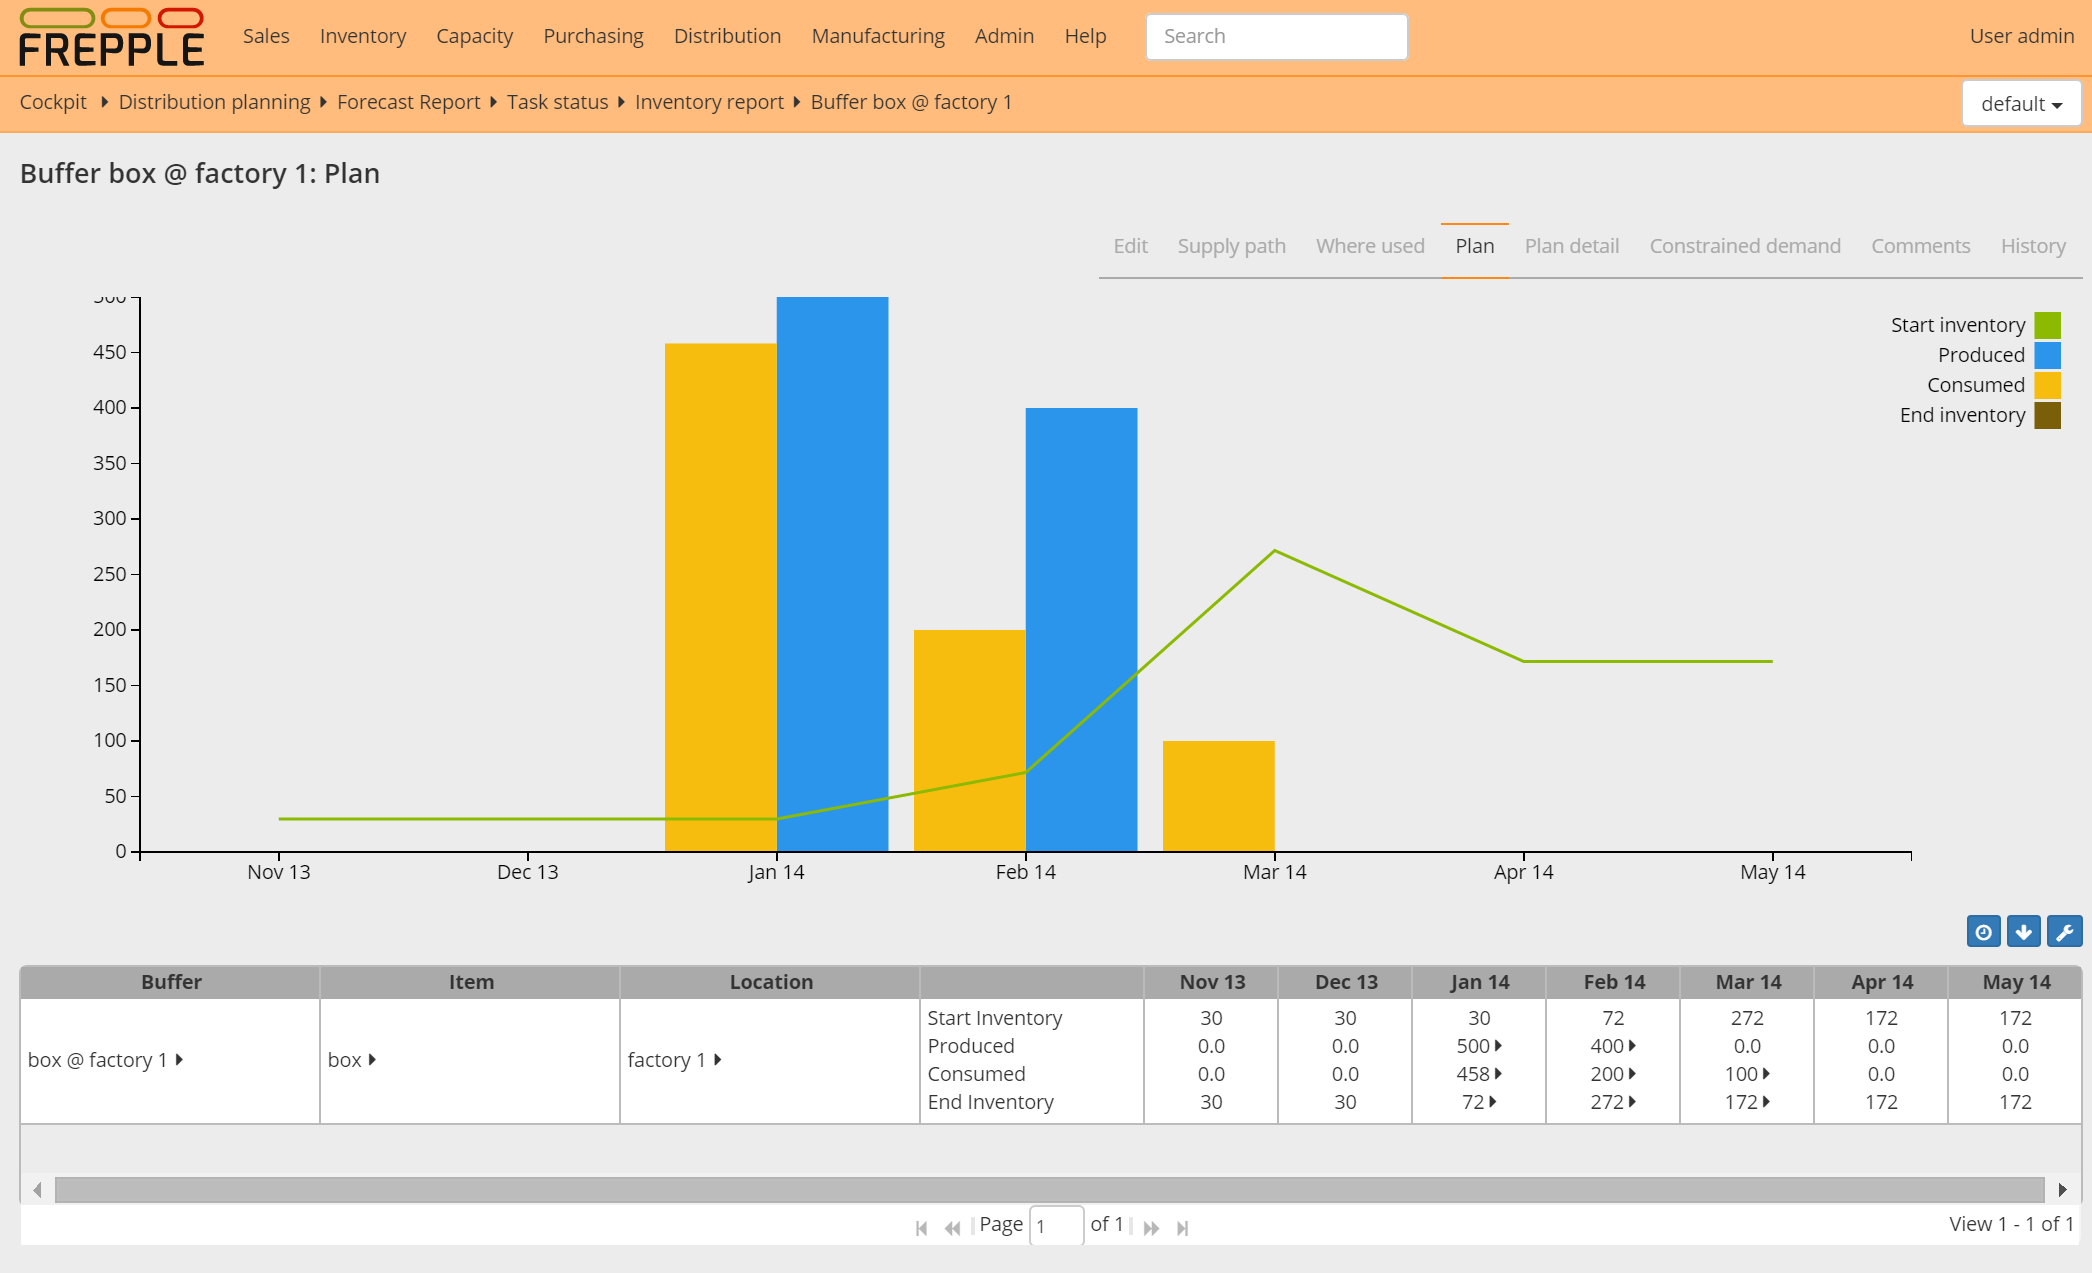
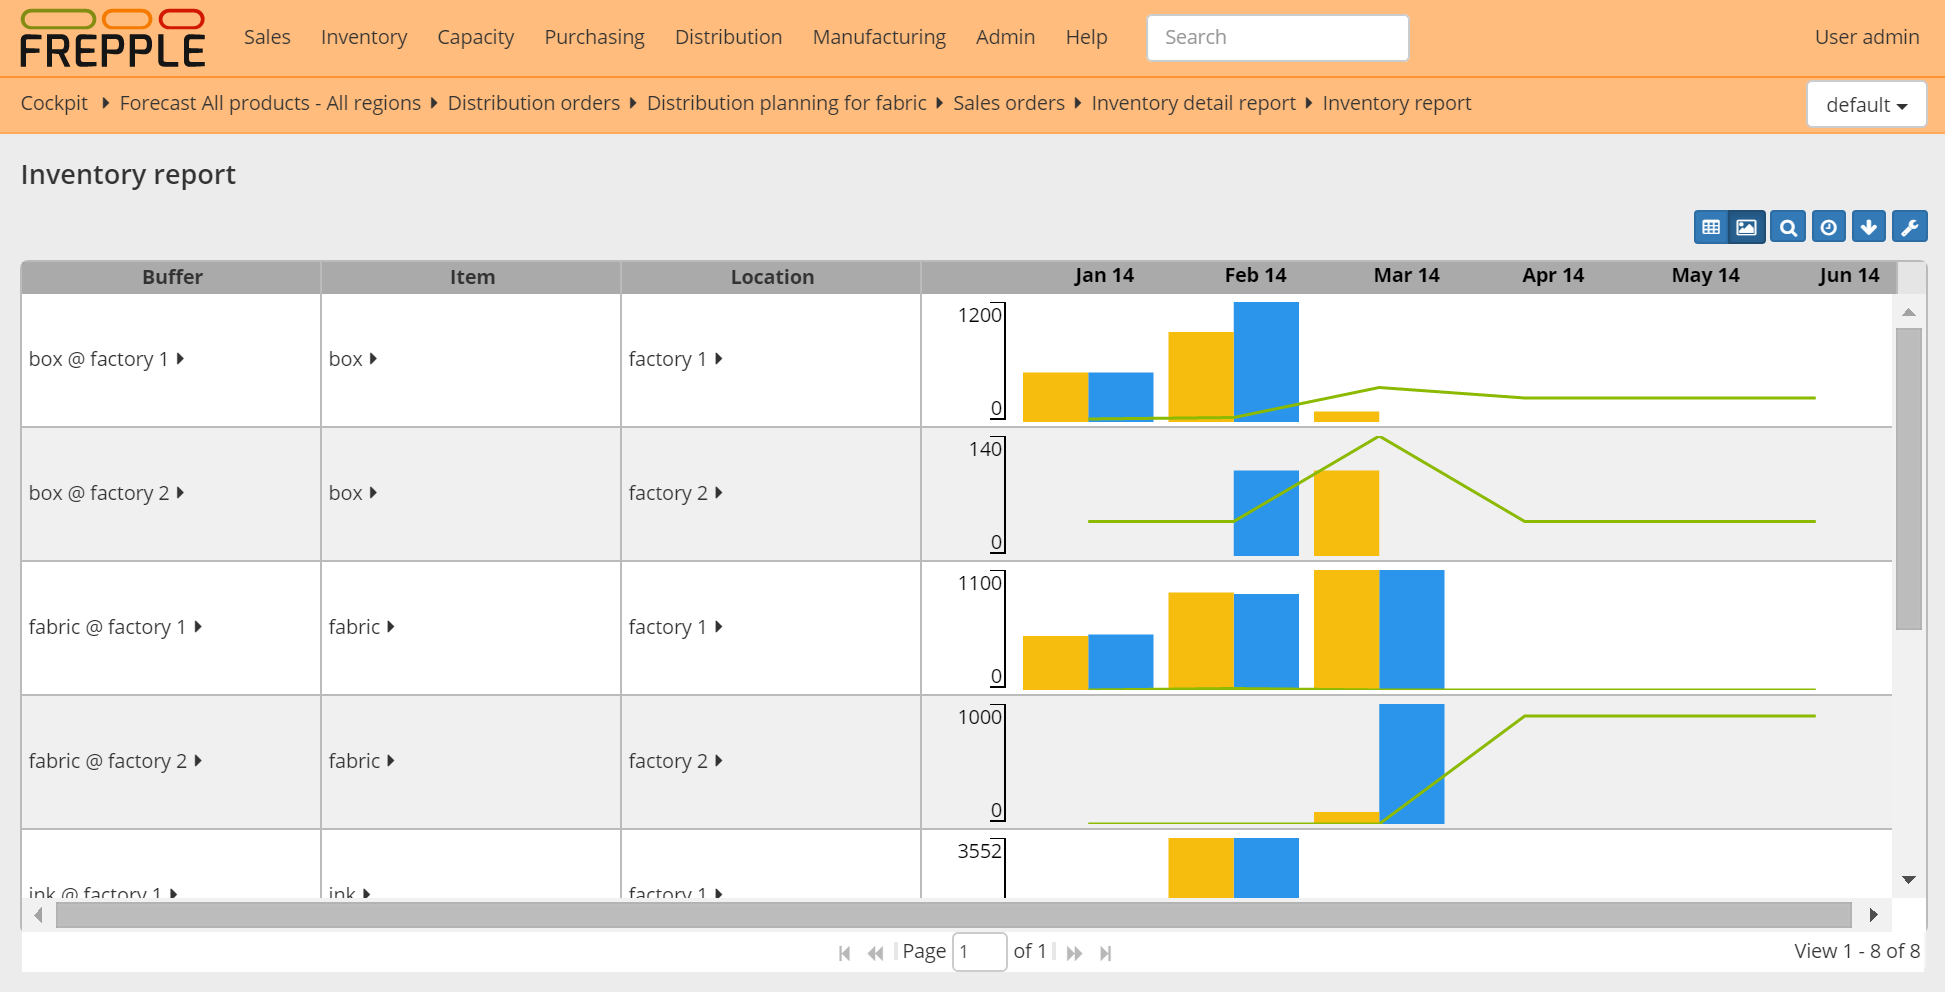
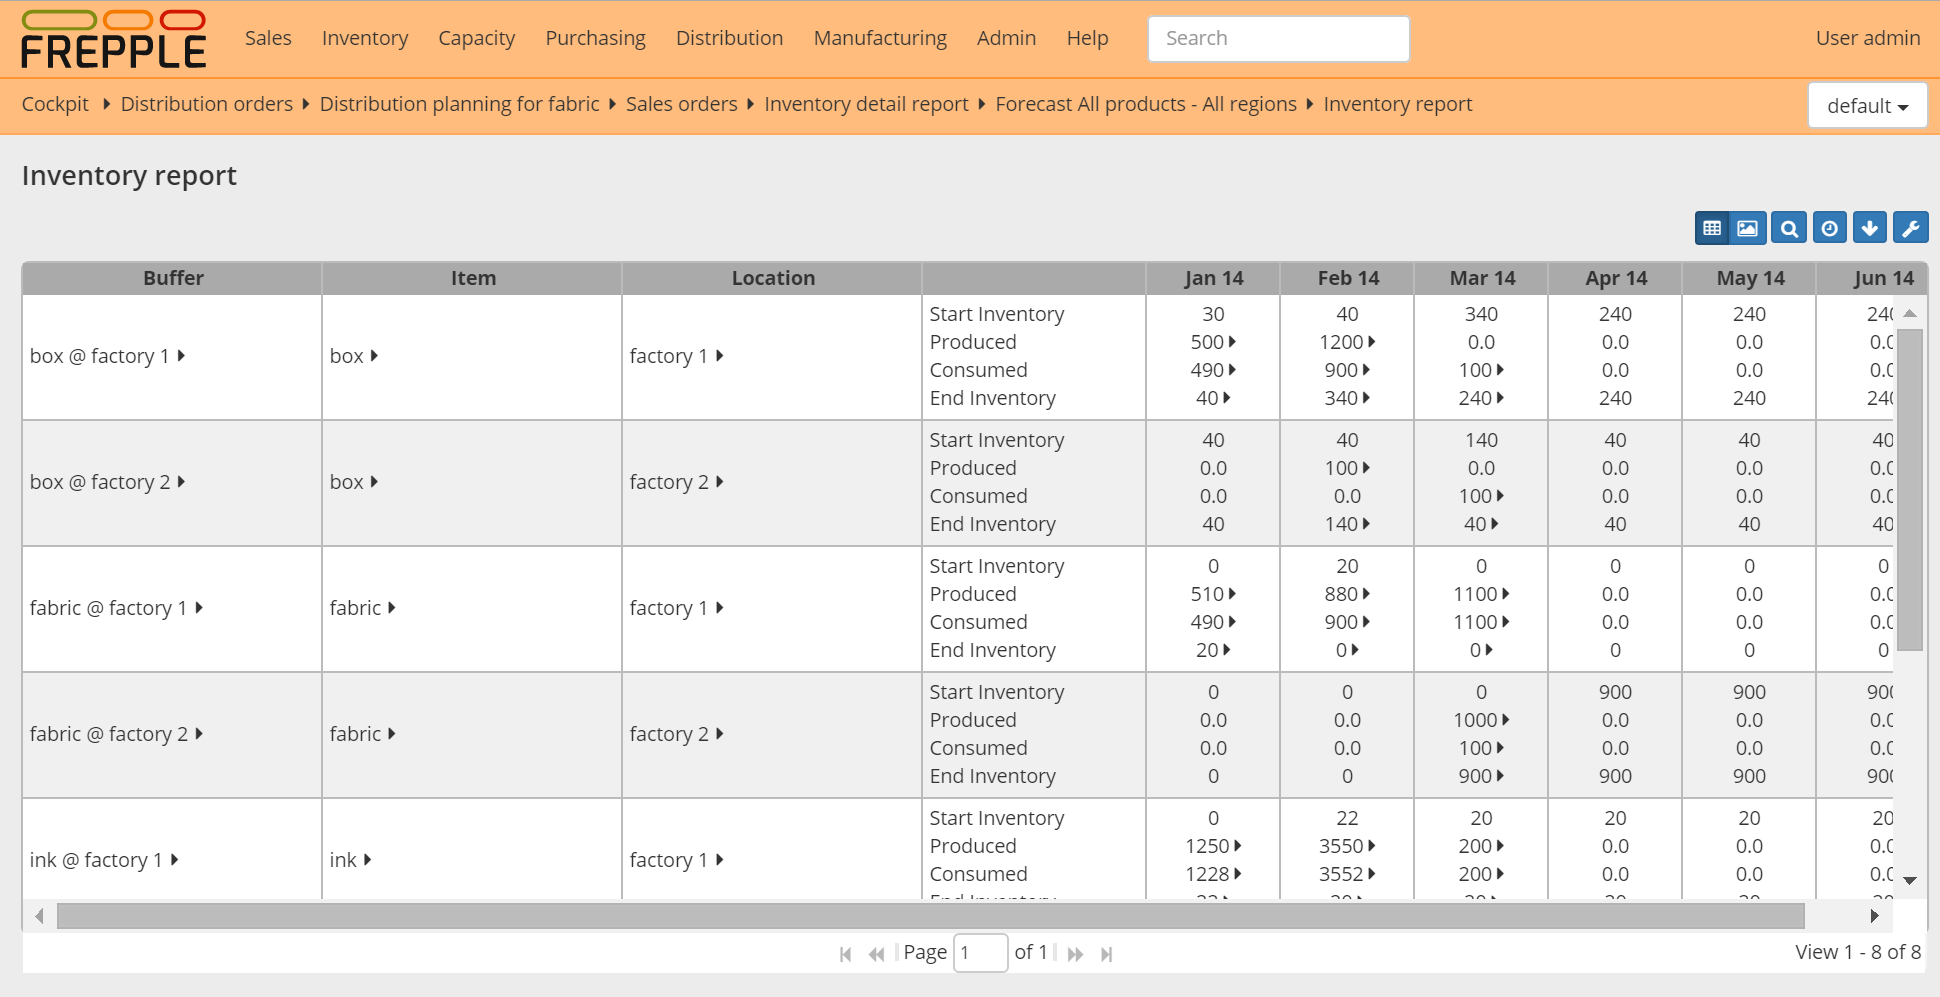
The report shows per buffer and per time bucket the inventory profile: the starting inventory, the material consumed, the material produced and the ending inventory.
If the report is opened for a single buffer an inventory graph is displayed.
| Field | Description |
|---|---|
| Item | Item stored in the buffer. |
| Location | Location of the buffer. |
| Start inventory | Inventory in the buffer at the start of the time bucket. |
| Produced | Quantity produced into the buffer during the time bucket.
A drill down menu is available to see the detail of the producing operations,
and to see the demands the consumed material is used for.
|
| Consumed | Quantity consumed into the buffer during the time bucket.
A drill down menu is available to see the detail of the consuming operations,
and to see the demands the consumed material is used for.
|
| End inventory | Inventory in the buffer at the end of the time bucket.
A drill down menu is available to see the detail of the consuming and
producing operations, and to see the demands the consumed material is used
for.
|