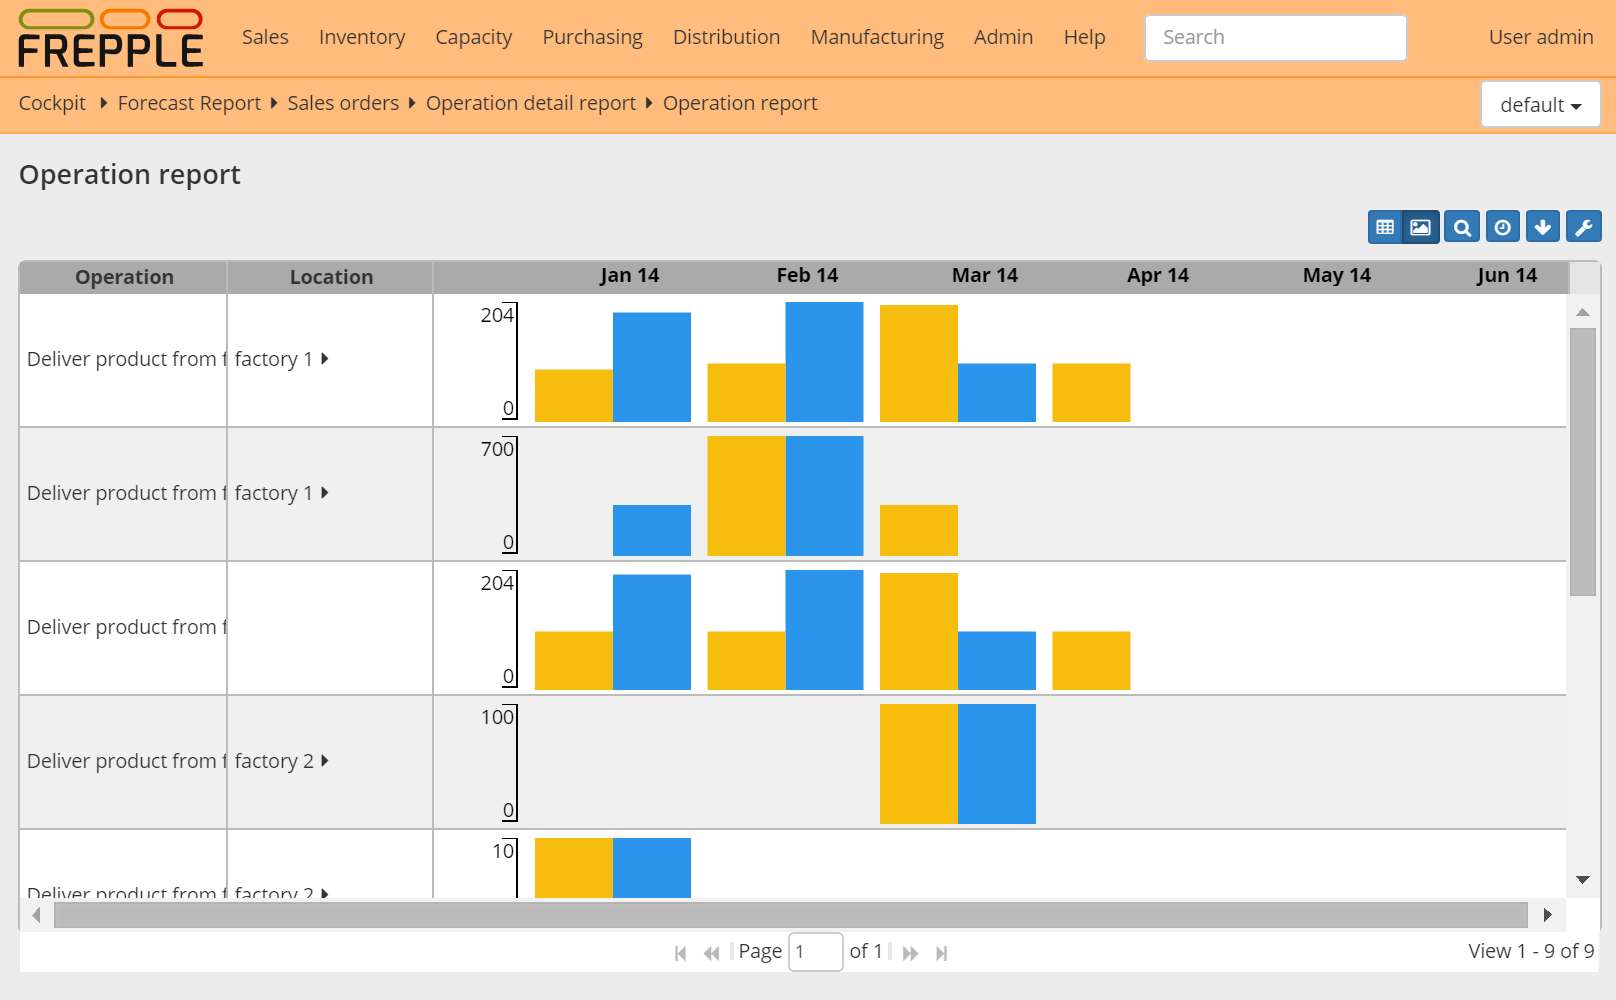
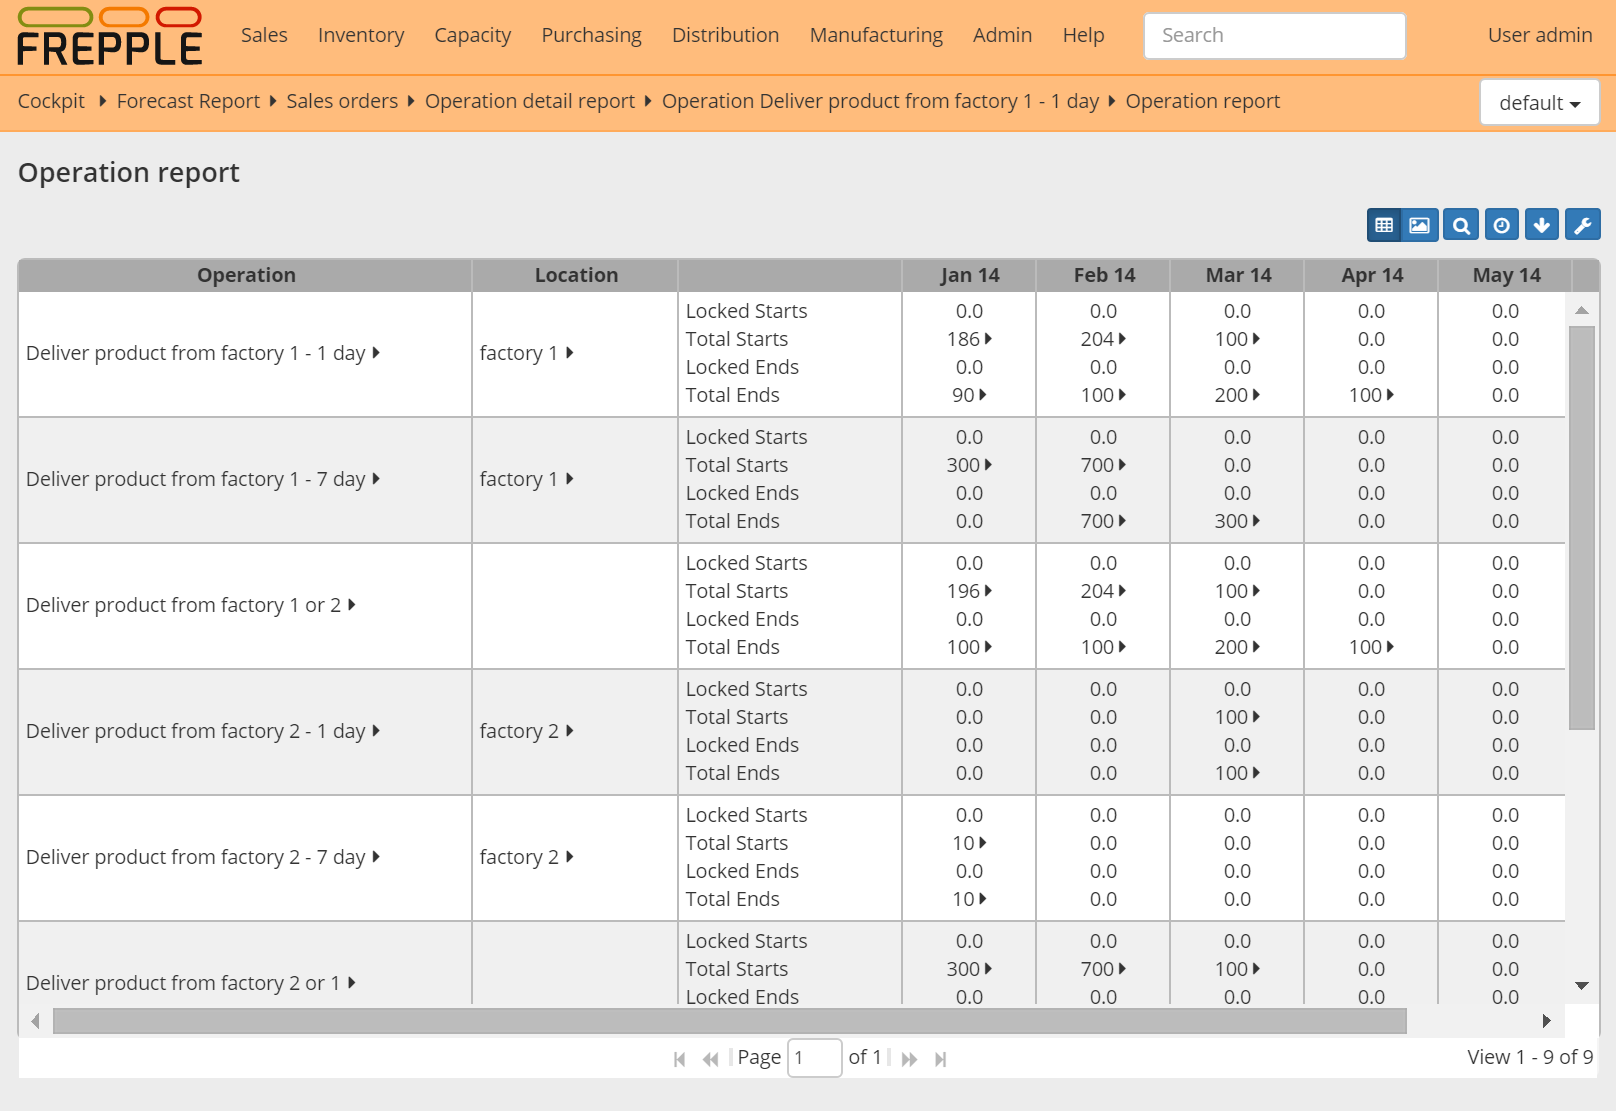
The report shows for each time bucket and each operation the quantity started and finished. A drilldown report is also available to show the detailed data as a list.
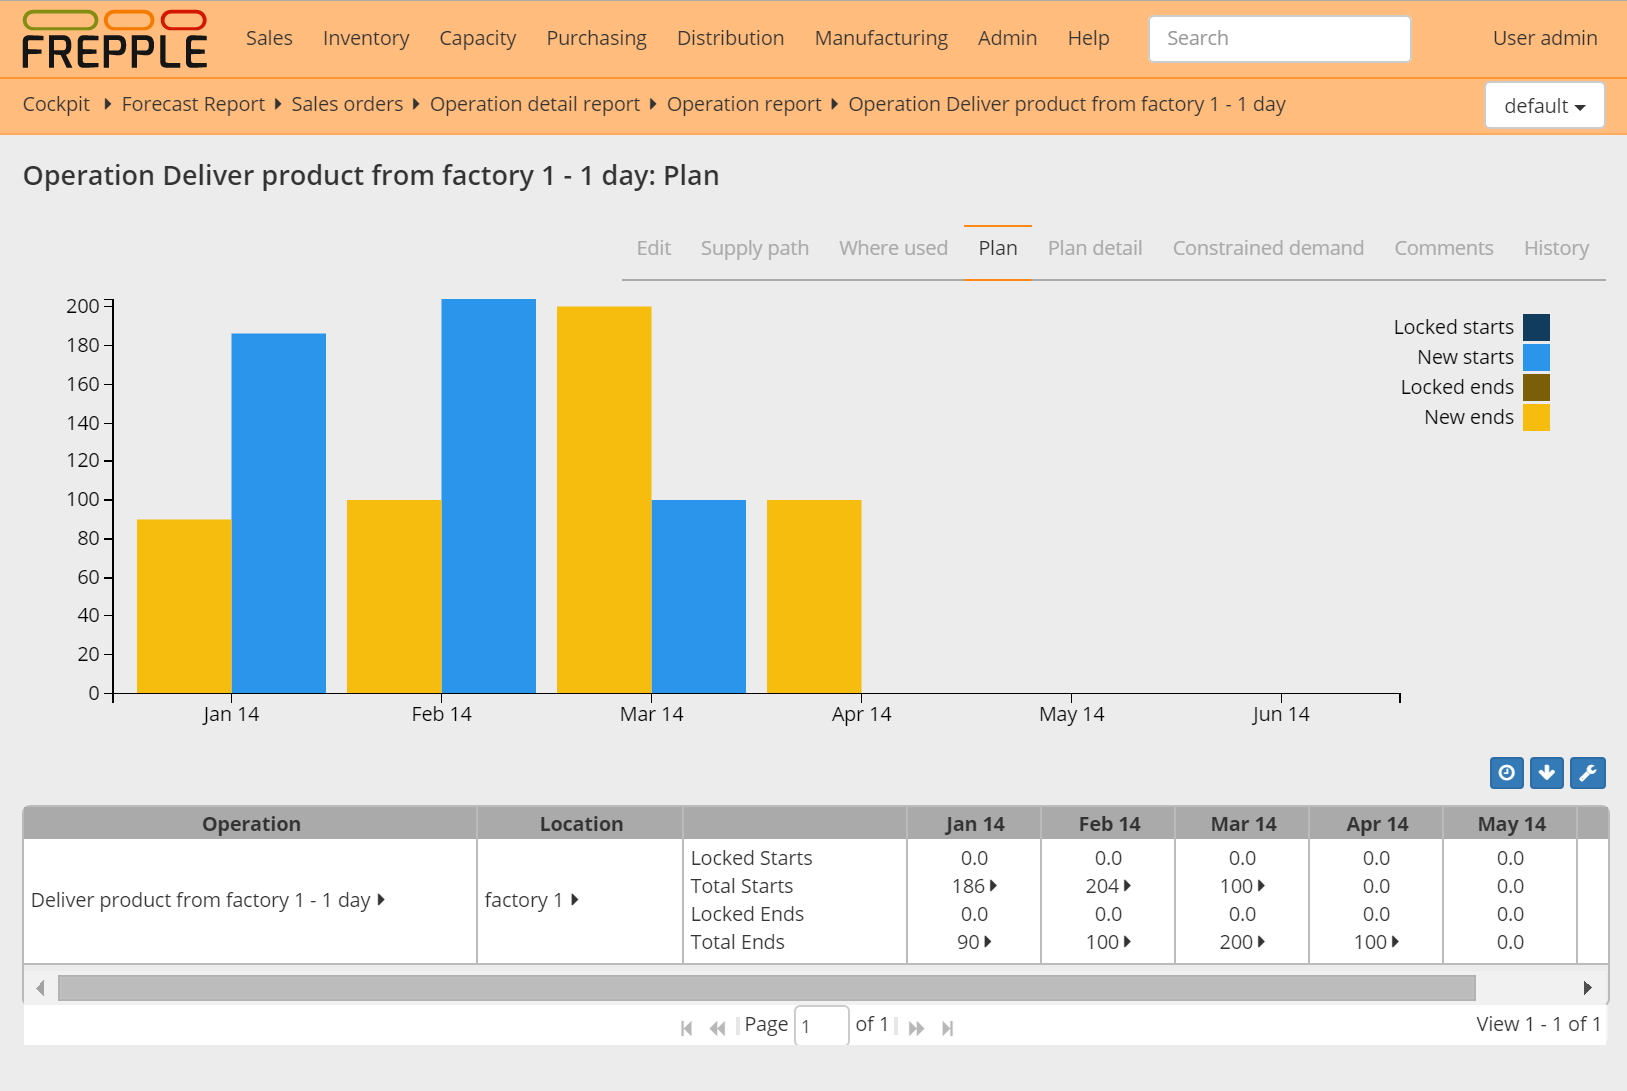
If the report is opened for a single operation a graph is displayed to visualize the results.
| Field | Description |
|---|---|
| Operation | Name of the operation. |
| Location | Location of the operation. |
| Locked starts | Sum of the quantity of all locked (ie frozen) operationplans starting in this bucket. |
| Total starts | Sum of the quantity of all operationplans starting in this bucket. |
| Locked ends | Sum of the quantity of all locked (ie frozen) operationplans ending in this bucket. |
| Total ends | Sum of the quantity of all operationplans starting in this bucket. |