- Additional Products >
- MongoDB Compass
MongoDB Compass
On this page
Overview
Data in MongoDB has a flexible schema. Collections do not enforce a rigidly-defined document structure and the schema of a collection is not defined or available for inspection within the database. MongoDB’s flexible schema and rich document structure make developers more productive, but they also make it difficult to explore and understand the underlying data and its structure without first executing queries in the shell against the database.
MongoDB Compass is a tool designed to allow users to easily analyze and understand their schema within MongoDB without having to connect to a shell or be familiar with the query syntax. It provides users with a graphical view of their MongoDB schema by randomly sampling a subset of documents from the entire collection. By sampling a subset of documents, MongoDB Compass has minimal impact on the performance of the database and can produce results to the user very quickly. For more information on sampling, see the Frequently Asked Questions section.
Getting Started
MongoDB Compass currently runs on Mac OS X and Windows. Software requirements to run Compass are listed below:
| Platform | Mac OS X | Windows | Linux |
|---|---|---|---|
| Supported? | ✓ | ✓ | |
| OS Version | 10.10+ | 7+ | N/A |
On Windows, Compass also requires .NET 4.5+.
To download Compass, see the downloads page.
Installing on OS X
The Compass package is downloaded as a .dmg disk image. After the download, open the disk image and drag the Compass application to the Applications folder.
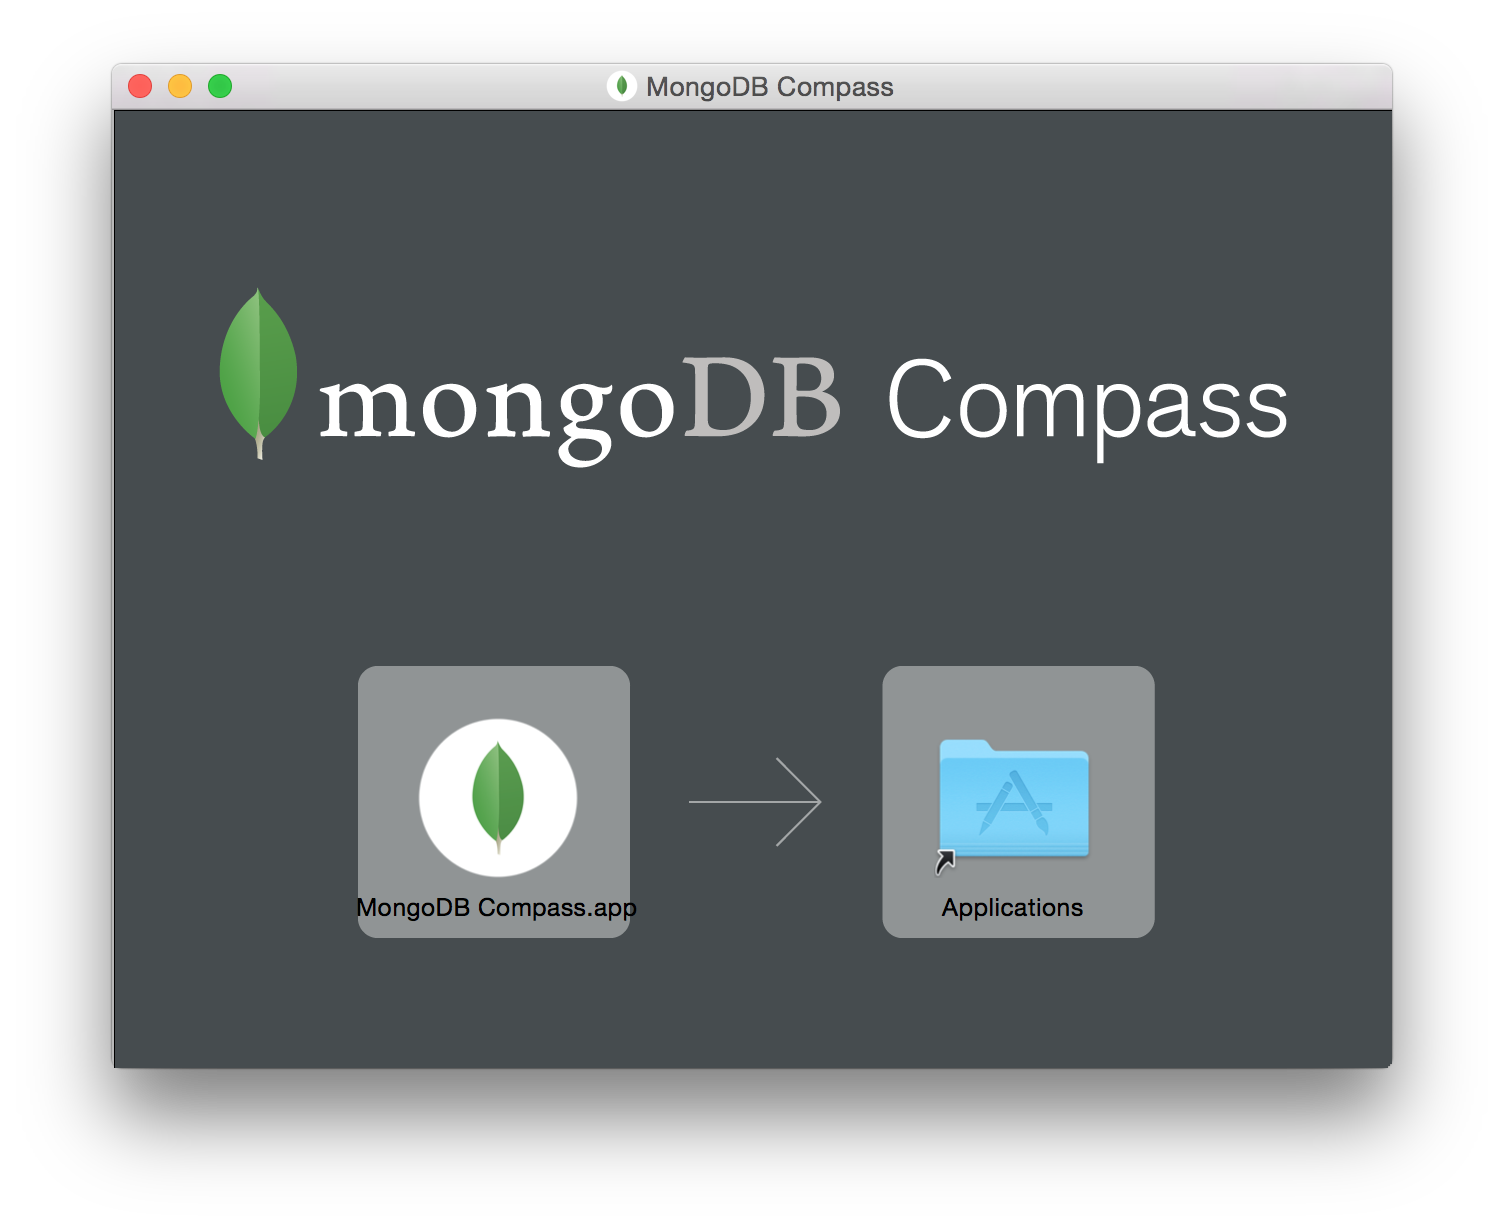
The installation is now complete and the disk image can be safely unmounted. Compass can be launched from the Applications directory.
Installing on Windows
The Compass setup application is downloaded as a .exe executable file. Run the program to begin the setup process, which will automatically install Compass.
Compass requires the Microsoft .NET Framework version 4.5 or later. If it is not already installed on the system, the setup program will prompt to automatically install .NET.
Starting Compass
Run and connect to MongoDB
When Compass is run for the first time, it presents the following initial connection dialog:
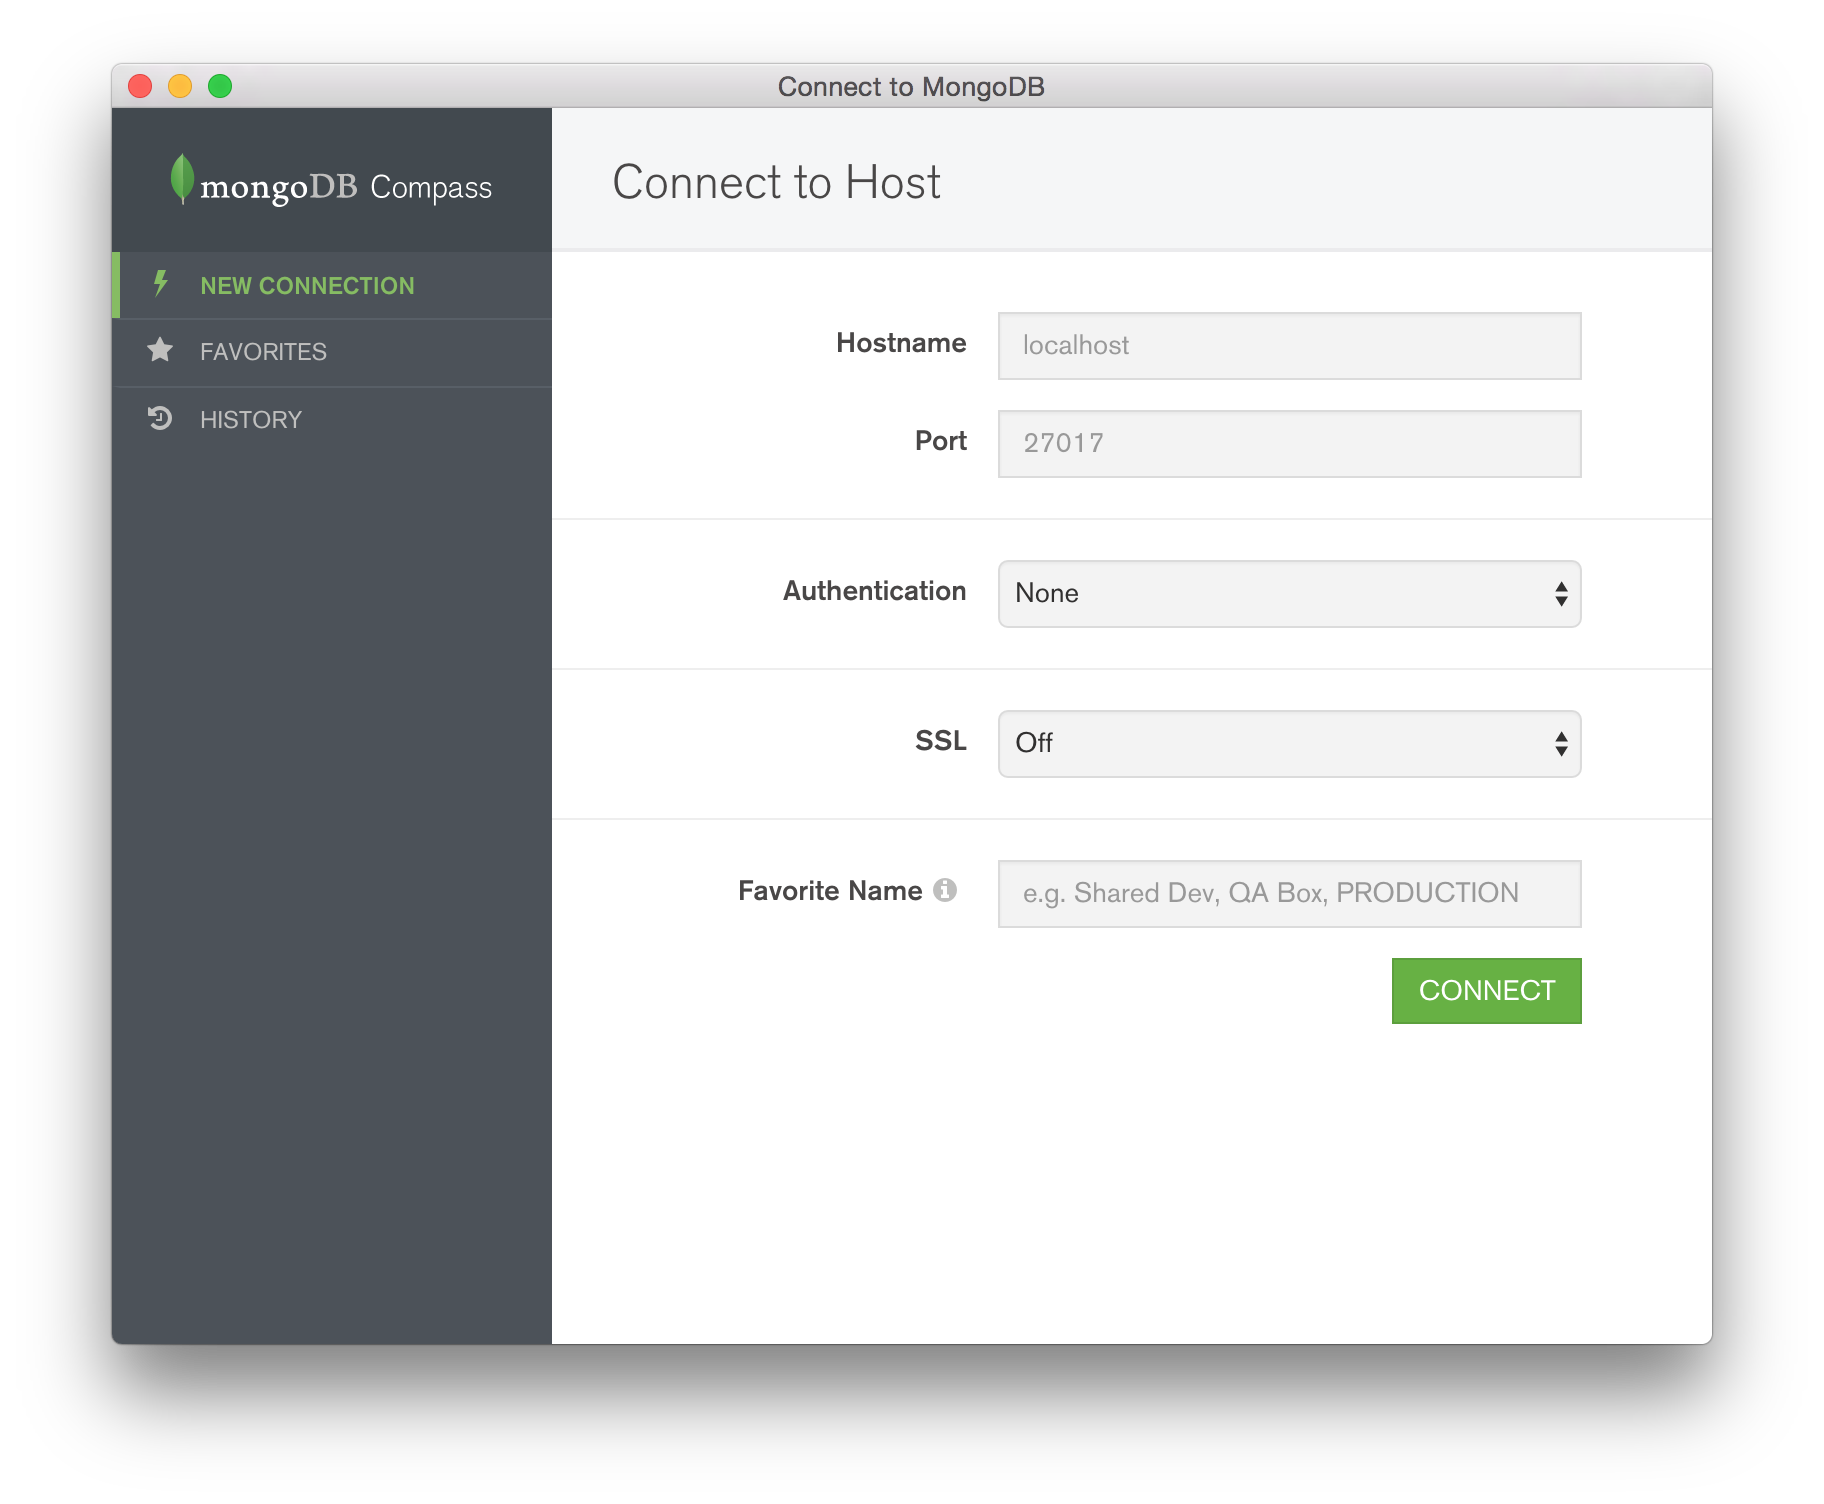
The following information is requested:
- Hostname: The hostname of the machine where mongod is running.
- Port: The port of the machine where mongod is running.
- Authentication: The authentication mechanism to connect to the target
host. Supported authentication mechanisms include:
- MongoDB-CR
- SCRAM-SHA-1
- Kerberos
- LDAP
- SSL: Whether or not Compass should connect to the target host with SSL.
Several SSL options are available:
- Unvalidated: If this option is used, the server cerficiate is not validated and no client certificate will be provided. The server must be set up to allow connections without valid certificates.
- Server Validation: The server certificate will be validated, but no client certificate will be provided. The server must be set up to allow connections without valid certificates.
- Server and Client Validation: The server certificate will be validated and a client certificate must be provided.
- Favorite Name (Optional): A nickname for the connection. Previous connections are saved in Compass; a descriptive name simplifies re-establishing the connection on future runs.
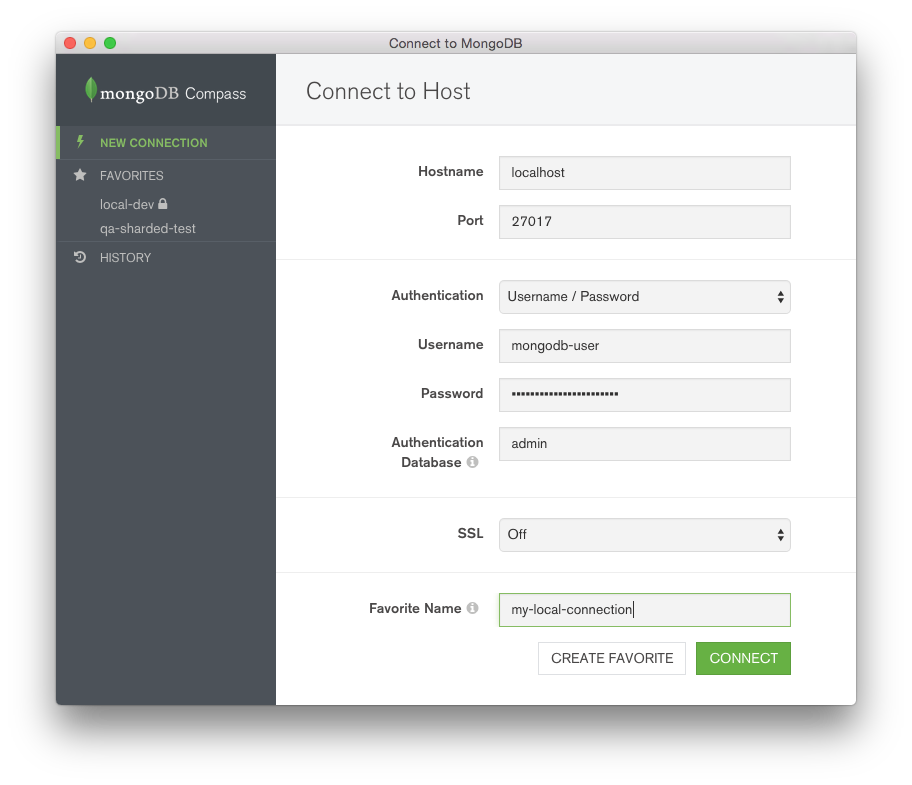
After providing the requested information, click “Connect” to launch the main Compass window.
Select a database and collection
Use the navigation pane to select a database and collection to analyze.
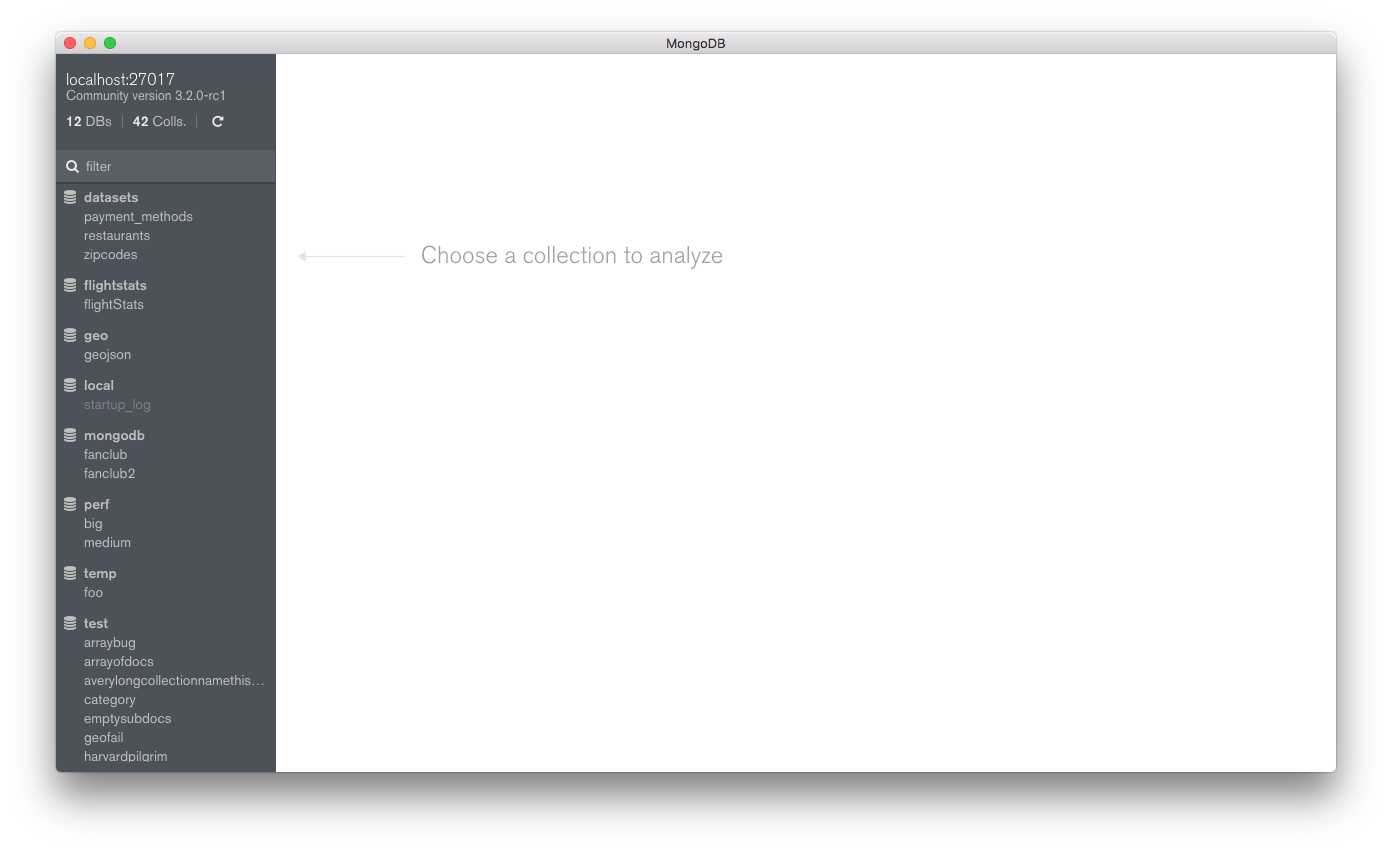
After making a selection, Compass will begin analyzing documents and present a summary screen. Below is an example; results will vary based on the contents of the collection.
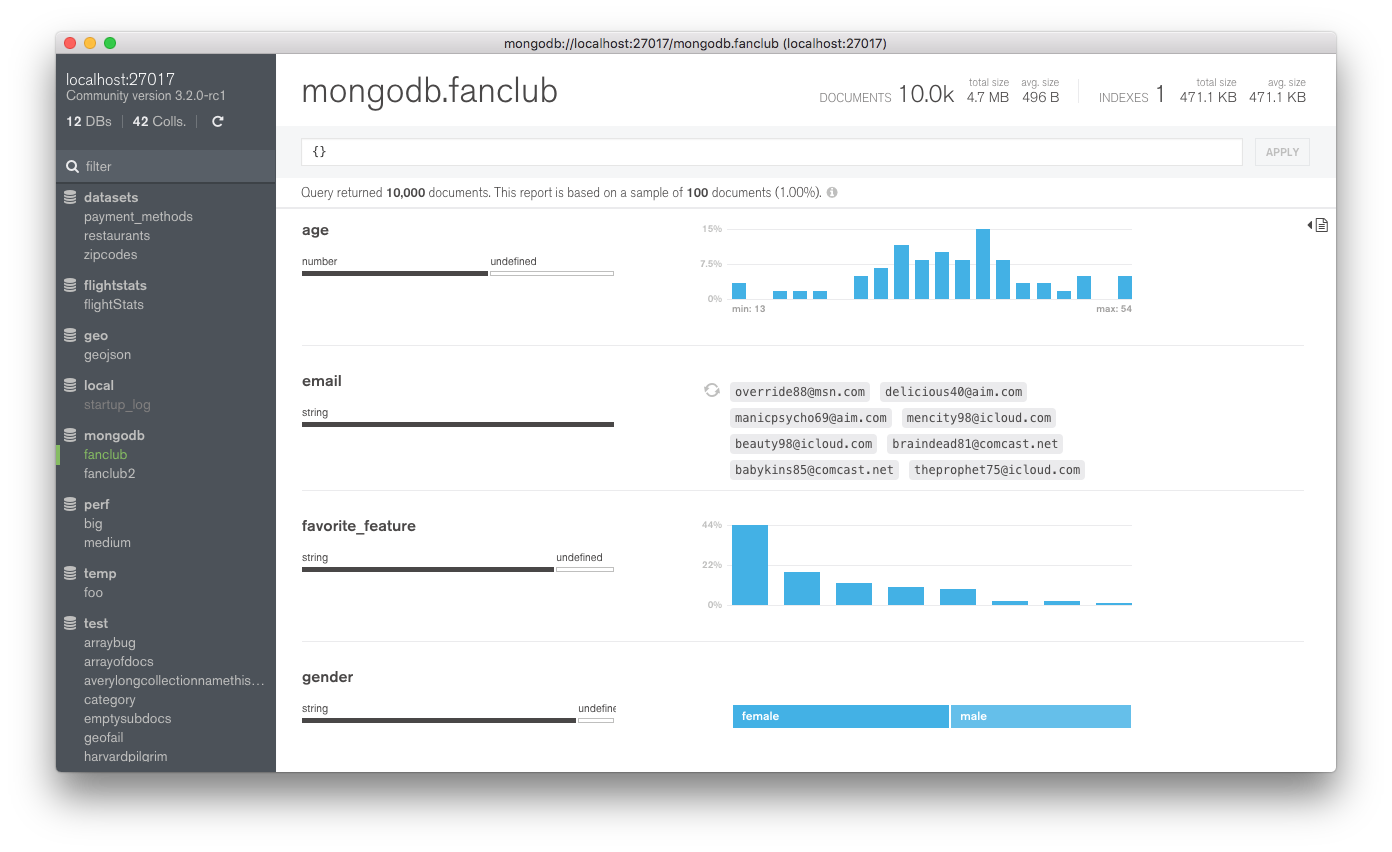
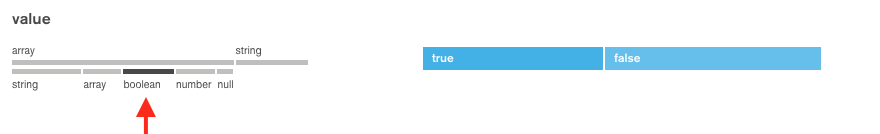
Data Types
Types and Missing Fields
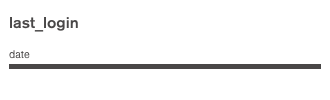
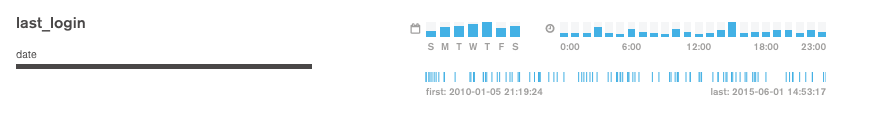
Compass displays the data types of fields in a collection’s schema. The example below reports that there are documents in the collection that contain a field last_login with the type date:
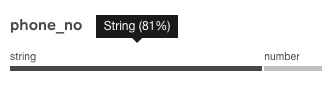
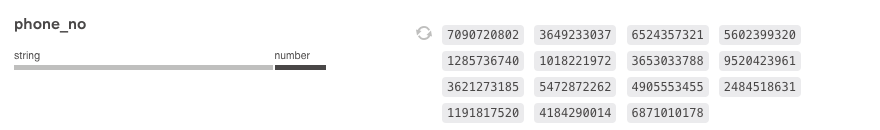
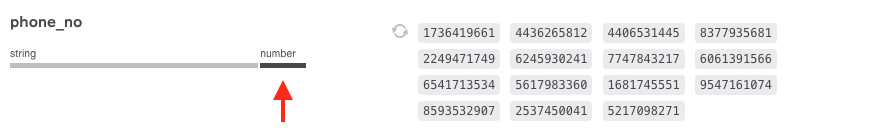
Compass also displays a percentage breakdown for fields with varying data types across documents. In this example, 81% of documents store phone_no as a string, and the remaining 19% store it as a number:
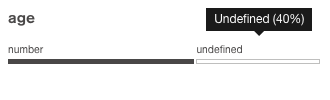
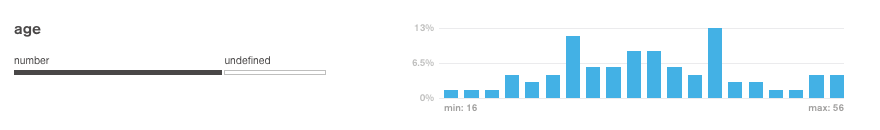
For sparse fields, where some documents omit a value, Compass displays the percentage of missing values as undefined. Here, the age field is missing in 40% of the sampled documents.
Understanding Charts
Compass displays different charts for data fields depending on their BSON type.
Strings
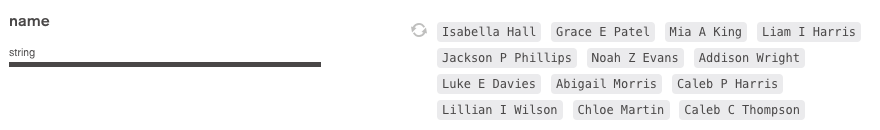
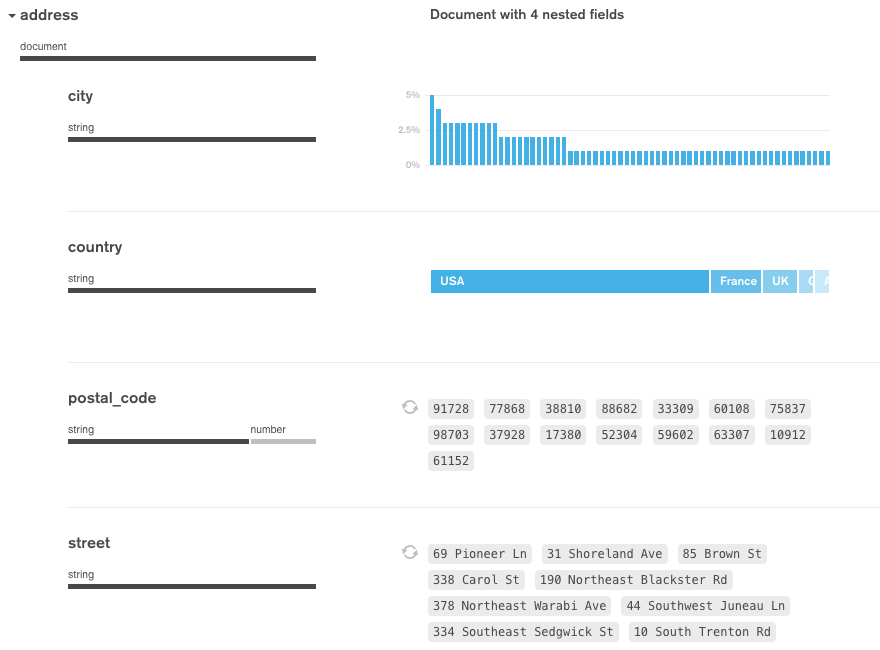
Strings can be displayed in three different ways. If all the documents in the collection have unique strings for a given field, Compass will display a random selection of string values. Click on the refresh icon to generate a new set of random strings sampled from the values for that field.
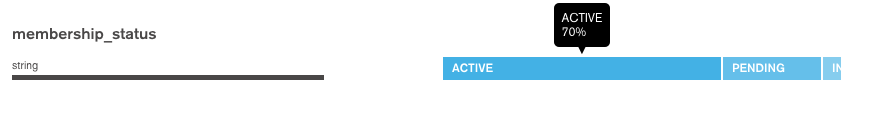
If there are only a handful of unique string values, Compass will show the strings in a single graded bar, indicating the percentage breakdown of string values.
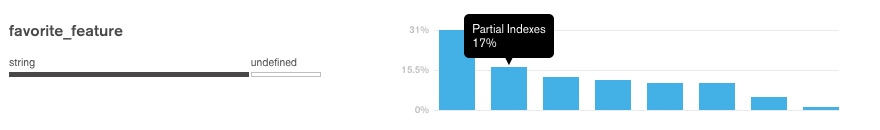
When there are many different string values with some duplication, Compass displays a histogram indicating the frequency of each string found for that field. Hover the mouse on each histogram bar to see a tool tip indicating the value of the string.
Numbers
Numbers are displayed in a similar manner to strings. A randomly-sampled subset of data is shown for an entirely unique data set.
For a data set of numbers containing duplicates, a histogram is shown to indicate frequency.
Sub-documents
Sub-document fields are displayed with a small triangle next to the field name, along with some additional data.
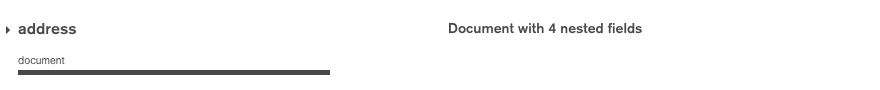
Click on the triangle to expand the field and view the sub-documents contained within.
Arrays
Fields containing an array are displayed with the type distribution of the array’s elements. A second type distribution bar is displayed beneath the array type.
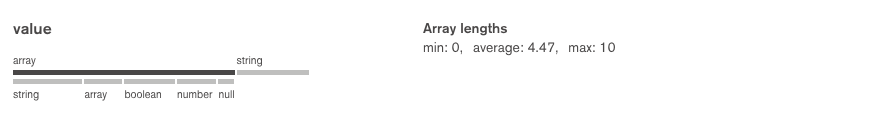
Click on an array sub-type to view a chart of the data for that specific type.
Dates and ObjectIDs
Bar charts are used to represent dates. They are also used for fields containing an ObjectID, from which a date can be extracted.
The two charts on the top row visualize the date’s data: the first is the day of the week of the timestamp, and the second is the hour of day. The third chart in the bottom row displays the range of timestamps: the earliest date, the most recent date and the distribution of all timestamps in between.
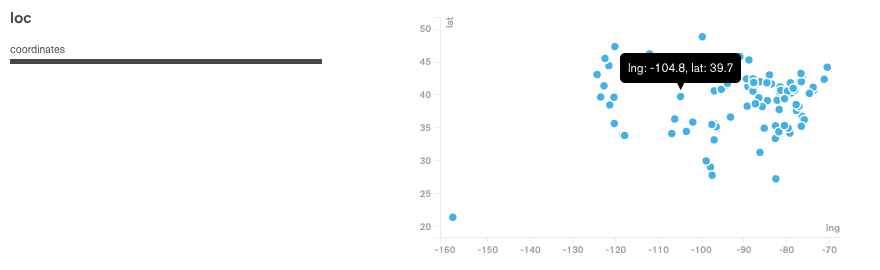
Coordinates
When Compass detects values that look like geographical coordinates, it displays the data in a scatter plot. Both GeoJSON documents and legacy coordinate pairs are supported.
Hover over points in the scatter plot with the mouse cursor to see a tooltip displaying latitude and longitude coordinates.
Mixed Types
When a field has mixed types throughout a collection, the type of chart displayed can be changed by clicking on a specific data type underneath the field name.
As an example, this phone_no field is a mix of strings and numbers. The chart displayed shows the values that are strings.
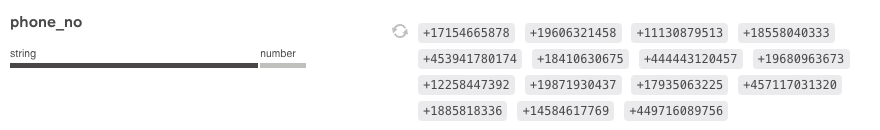
Click on the number data type to view the values that are numbers instead.
Building Queries
There are two methods of building queries in Compass: automatic generation with the query builder, or manual entry in the query bar.
Using the Query Builder
Select values from charts
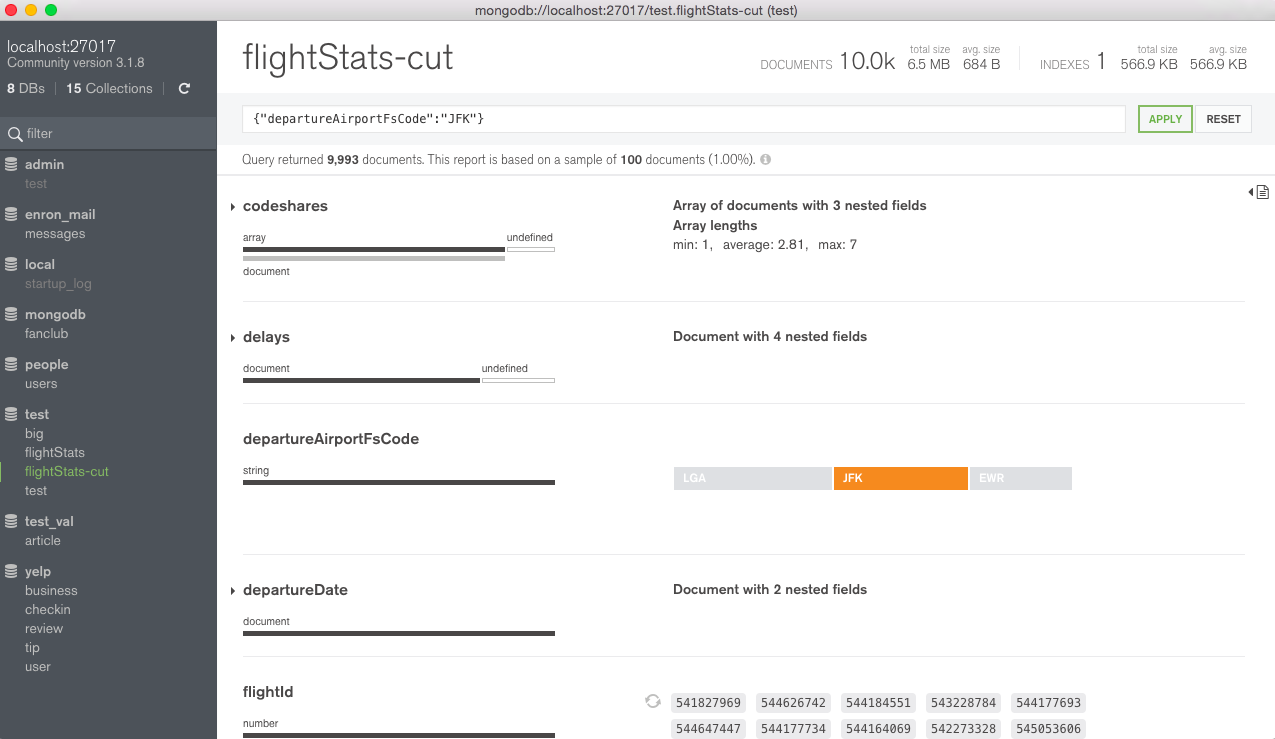
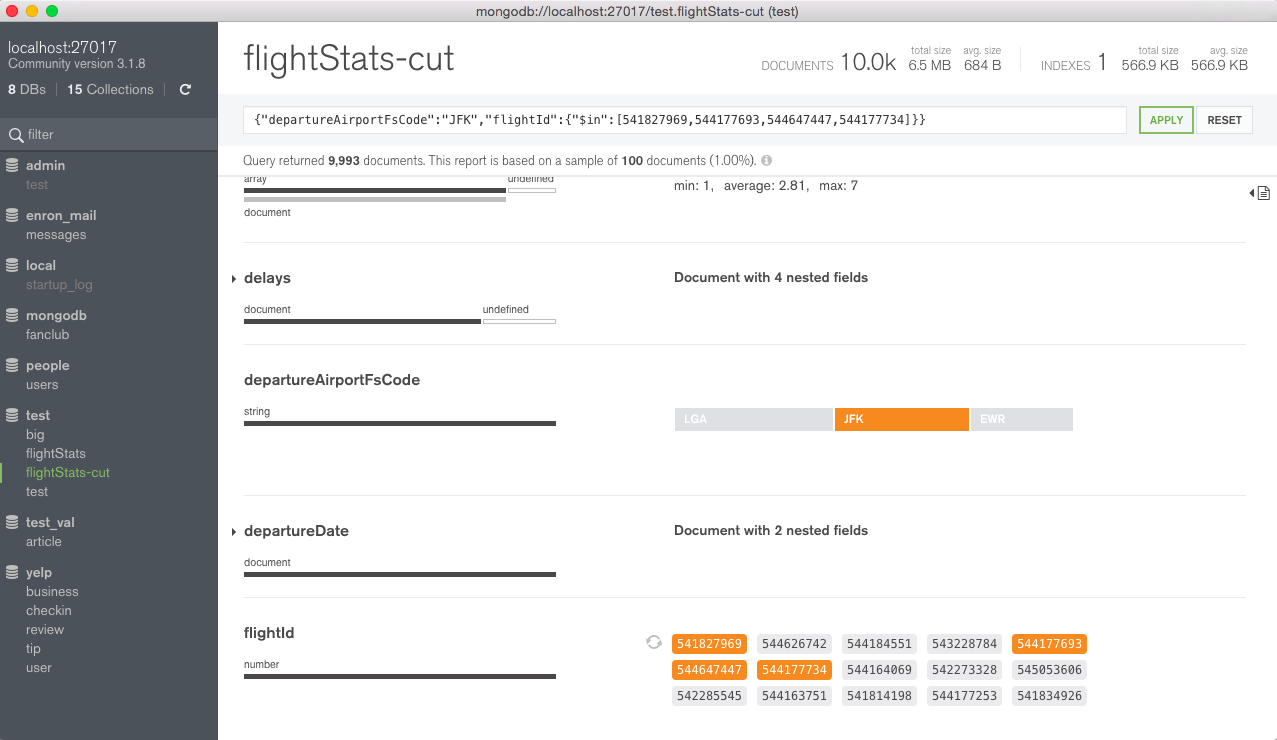
Charts in Compass are fully interactive. Clicking on a chart value or bar will automatically build a MongoDB query that matches the documents pertaining to that section of the chart.
In the example below, clicking on the “JFK” bar builds a query matching all documents whose departureAirportFsCode field matches “JFK”.
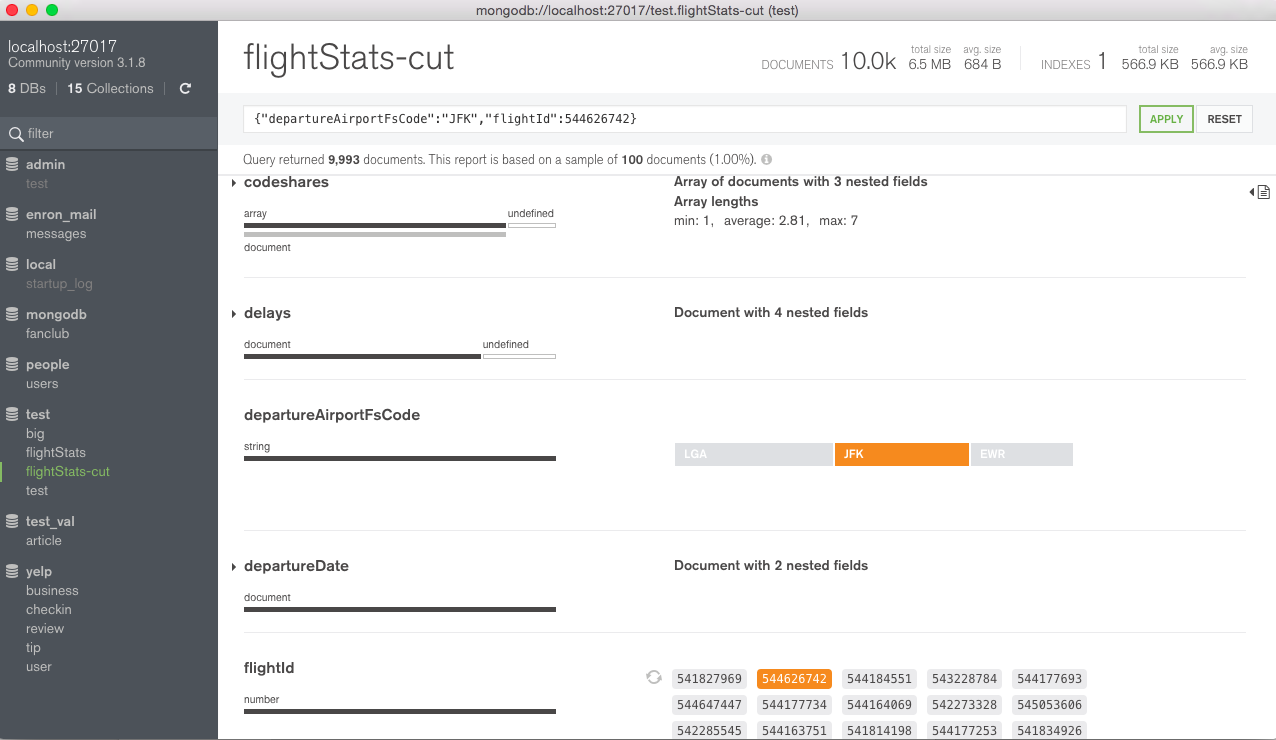
Clicking on other field values adds them to the selection, creating a more complex query.
Continuing with the example, this selects a particular flightId in addition to departures from JFK Airport.
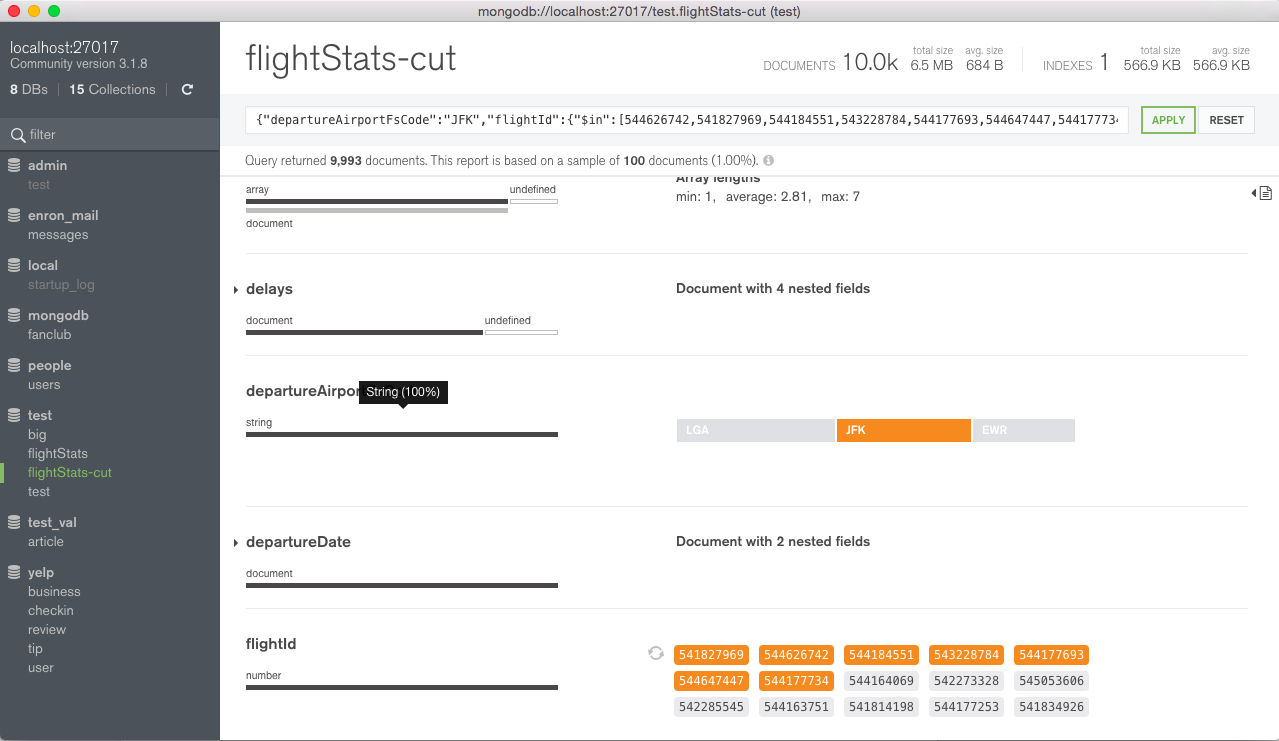
To select multiple values within the same field, click and drag the mouse over a selection of values. Alternatively, hold the Shift key while selecting the desired values.
To deselect a previously-selected value, hold the Shift key while clicking on the selection.
Apply the query
After building a query, run it by clicking the Apply button. To clear the query, use the Reset button.
Note that composing “OR” queries is not yet possible with the automatic query builder.
Manual Queries
In addition to the automatic query builder, queries can be manually entered into the query bar. It is also possible to manually edit queries built from the automatic query builder for further refining.
Enter a query in the query bar
Queries entered in the query bar must be valid MongoDB syntax. Only finds will be executed.
This example manually selects documents whose departureAirportFsCode is “JFK”.
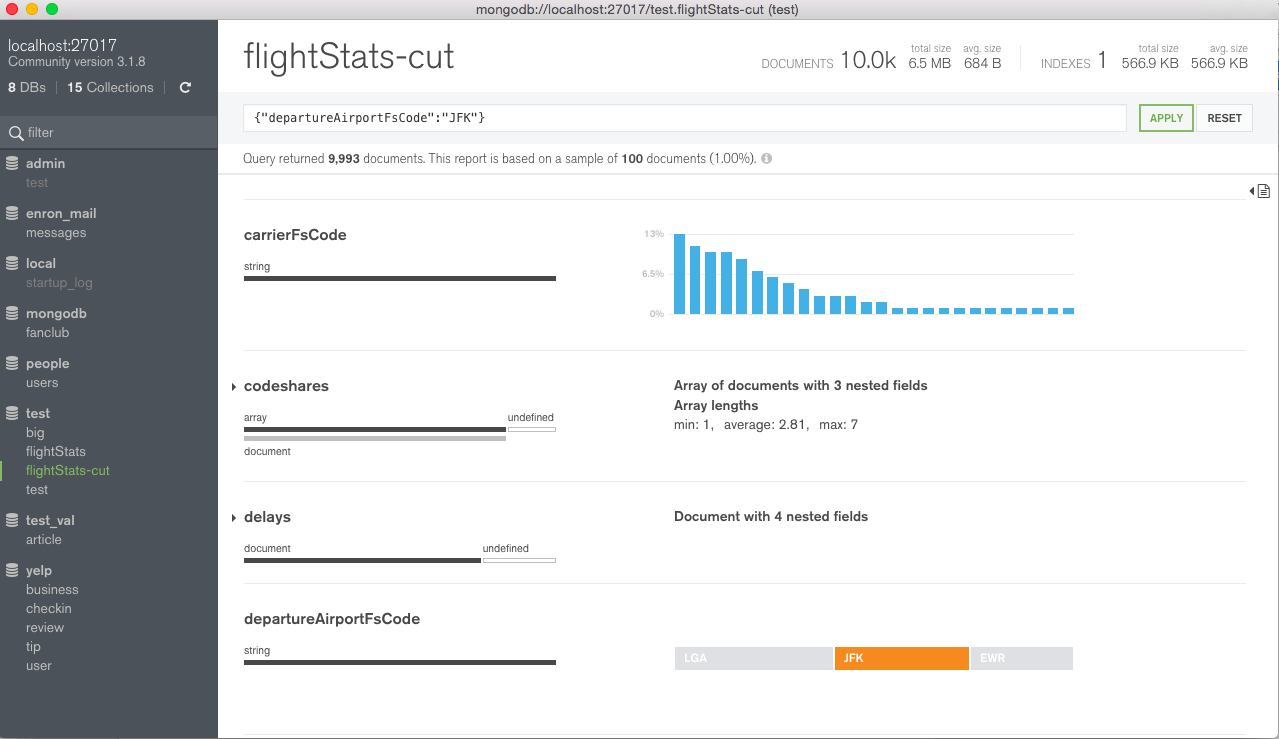
When a valid query is entered, the bar is colored green and can be executed. Invalid queries are colored red. The UI will automatically update to indicate which fields and values are selected in the query.
Apply the query
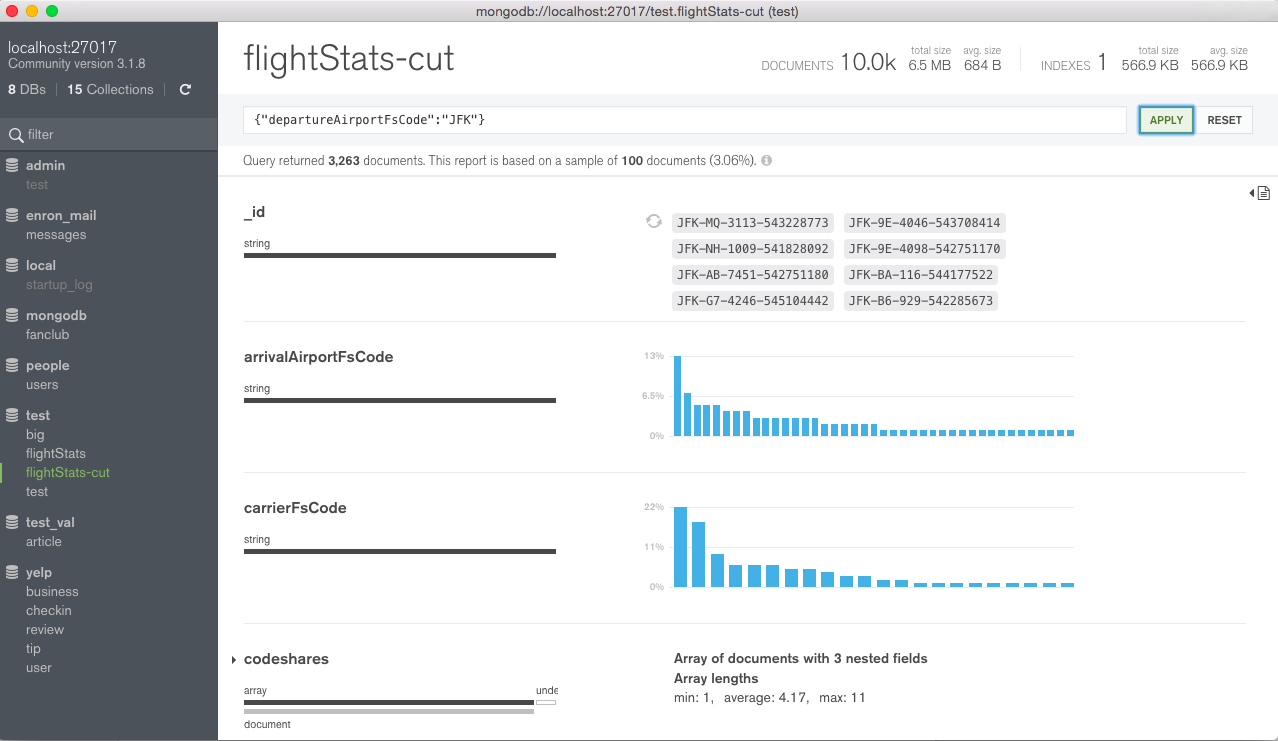
After entering a query, run it by clicking the Apply button. To clear the query, use the Reset button.
Continuing with the example, executing the query displays information on the matching documents.
To clear a query, use the Reset button.
Query Results
The query is executed on the full collection. If the result set is larger than the sampleSize threshold (100 documents), then a random subset of sampleSize documents is chosen from the result set and displayed in the UI.
Viewing Documents
Documents can be examined in the document viewing pane. This can be expanded by clicking on the Document Viewer icon on the right-hand side of the page.
By default, the pane displays all of the documents sampled by Compass. If a query is specified in the query bar, only documents that match the query are shown.
Frequently Asked Questions
What is the performance impact of running this tool?
Testing has shown that Compass has minimal impact in prototype deployments, though additional performance testing and monitoring is in progress.
For best results, use MongoDB 3.2, which includes the $sample operator for efficient sampling on a collection. On older versions of MongoDB, Compass falls back on a less efficient sampling method.
It is recommended to only execute queries that are appropriately indexed in the database to avoid scanning the entire collection.
What is sampling and why is it used?
Sampling in Compass is the procedure of selecting a subset of data from a particular collection and analyzing the documents within the sample set.
Sampling is a common technique in statistical analysis because analyzing a subset of the data gives similar results to analyzing all of it. In addition, sampling allows results to be generated quickly rather than performing a computationally-expensive collection scan.
How does sampling work?
Compass employs two distinct sampling mechanisms.
In MongoDB 3.2, collections are sampled with the $sample operator via the Aggregation Pipeline. This provides efficient random sampling without replacement over the entire collection, or over the subset of documents specified by a query.
In MongoDB 3.0 and 2.6, collections are sampled via a backwards-compatible algorithm executed entirely within Compass. It takes place in three stages:
- Compass opens a cursor on the desired collection, limited to at most 10000 documents sorted in descending order of the _id field.
- sampleSize documents are randomly selected from the stream. To do this efficiently, Compass employs reservoir sampling.
- Compass performs a query to select the chosen documents directly via _id.
sampleSize is set to 100 documents.
Note that the choice of sampling method is done transparently in the background, with no changes required by the user.
Won’t sampling miss documents?
Sampling is chosen for its efficiency: the amount of time required to perform a sample is minimal, on the order of a few seconds. Increasing the sample confidence will demand more processing power and time. Furthermore, sophisticated outlier detection requires an inspection of every document in a MongoDB deployment, which would be unfeasible for large data sets. The MongoDB team is in the process of conducting user tests on large data sets to find a reasonable balance.
Known Issues
For a list of known issues, please see the MongoDB Compass JIRA project.
Contact
Any questions, concerns or feedback on MongoDB Compass is appreciated. To report a bug, submit a ticket to the MongoDB Commercial Support JIRA. To submit a feature request, use the Compass JIRA.
Thank you for your feedback!
We're sorry! You can Report a Problem to help us improve this page.