Monitor cluster usage
View, monitor and share the status of your clusters, pods and individual nodes from the Anaconda Enterprise Operations Center. The graphs include:
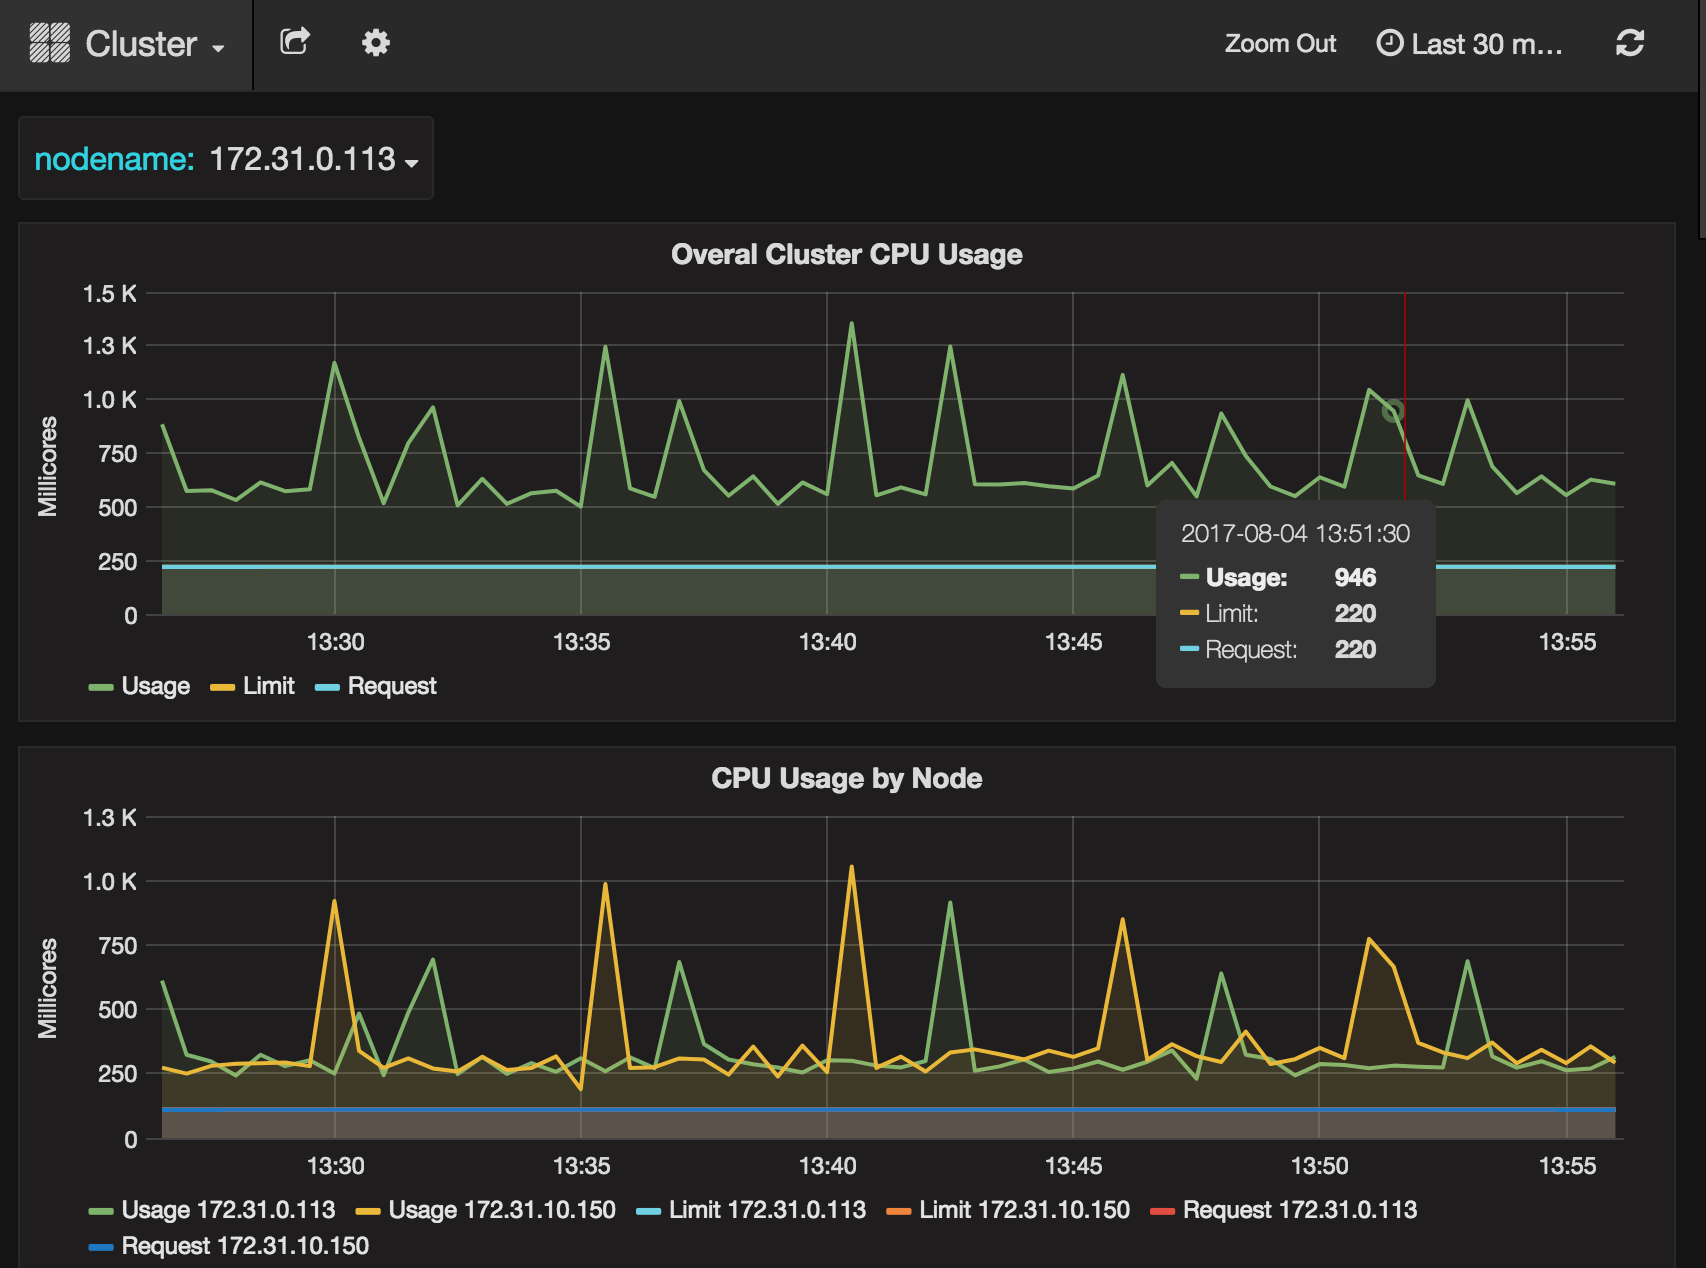
- Overall cluster CPU usage
- CPU usage by node
- Individual CPU usage
- Overall cluster memory usage
- Memory usage by node
- Individual node memory usage
- Overall cluster network usage
- Network usage by node
- Individual node network usage
- Overall cluster filesystem usage
- Filesystem usage by node
- Individual filesystem usage
All graphs can be modified by time range. The default time range is the previous thirty minutes.
View graphs
To view any or all of these graphs, open the Operations Center, then from the left navigation click the Monitoring link.
The graphs listed above all display.
Select cluster, pod or node
Select the cluster, pod and/or node you want to monitor by clicking the “Cluster” link at the top of the page, then from the drop-down menu that appears select the cluster or Pod. You can then optionally select a specific nodename to monitor.
Modify time range displayed
Click an operation to select and monitor it, or click the Logs button at the far right of an operation to view its log.