EdX Insights
The following information describes what is new in edX Insights.
1 December 2015
The course Home page in edX Insights now includes a link to Studio. The new Studio link opens the Course Outline page, and appears below the links to the Courseware page and the Instructor Dashboard in the LMS.
10 November 2015
Information about your course, and links to the LMS, are now available on the edX Insights course Home page. You can now verify the course start and end dates without having to visit the Schedule & Details page in Studio. You can also follow the links to access either the courseware or the Instructor Dashboard.

This release adds one-click access to the video player in Insights. When you work with the “Engagement with Video” feature to review a graph of learners’ viewing patterns for a video, you can now select Expand Preview to play that video. The View Live option is also available so that you can open the LMS to the unit that contains this video component.
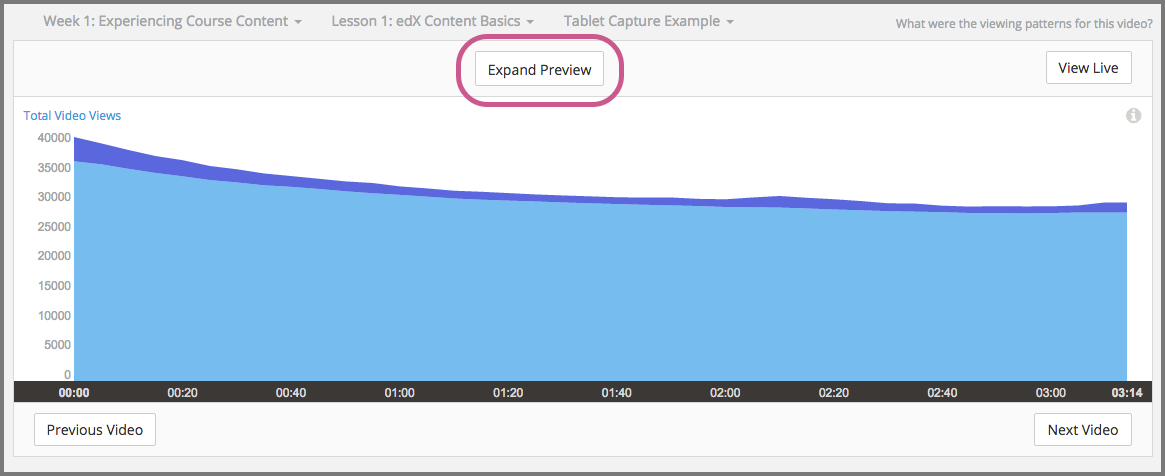
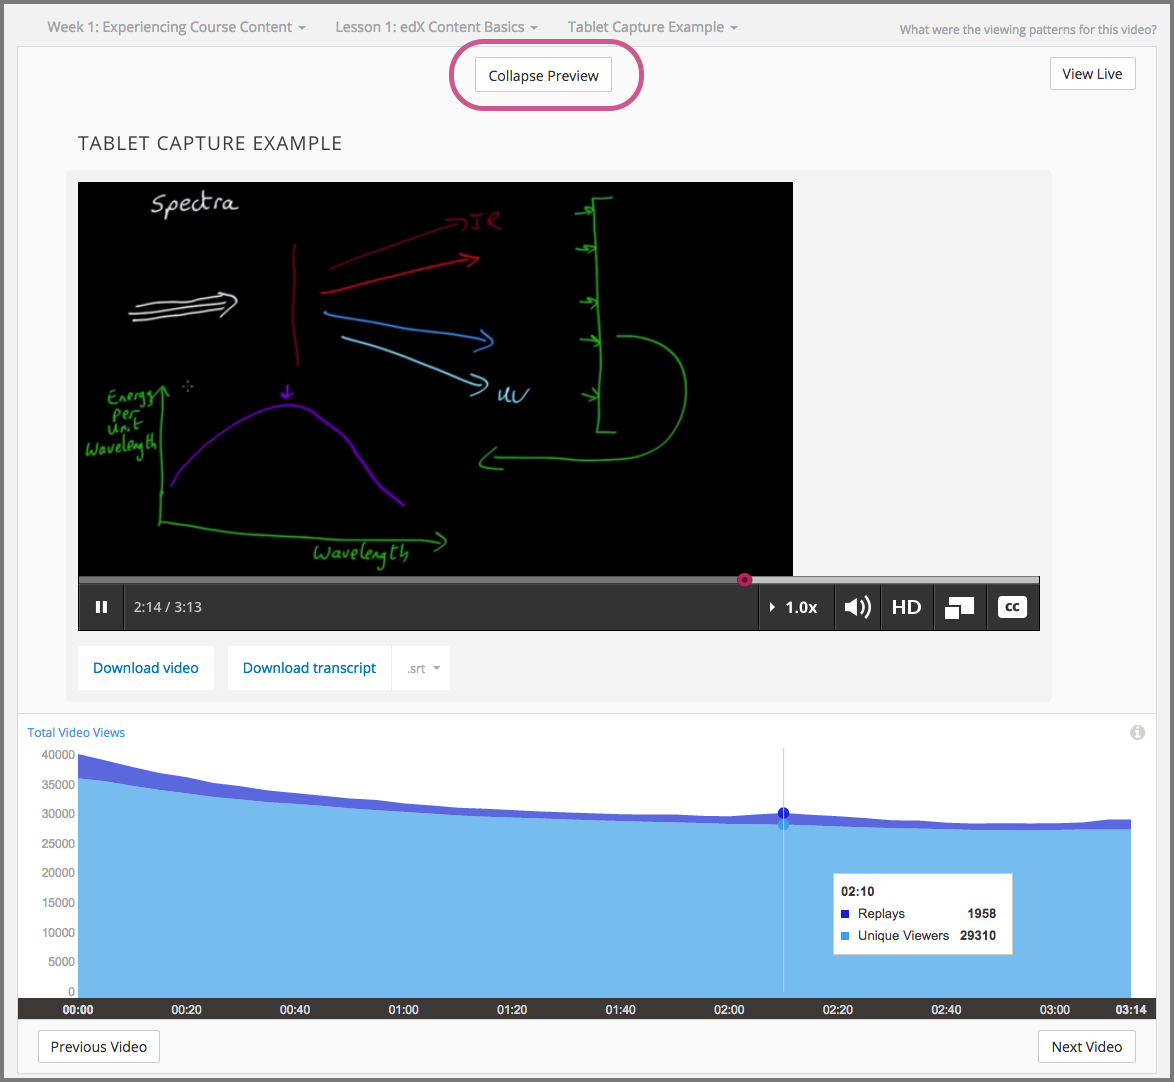
For more information, see the Engagement with Course Videos section in the Using edX Insights guide.
4 November 2015
The metrics for learner engagement with course content (active students, watched a video, and tried a problem), are enhanced in this release to show percentages in addition to totals.

For more information, see the Engagement with Course Content section in the Using edX Insights guide.
8 October 2015
Data for each of your course videos is now available in edX Insights. How many learners started viewing the video, and how many actually completed it? What parts of the video did learners replay, and what parts did they skip over? In Insights, metrics and tool tips provide the exact counts, and a chart helps you visualize your learners’ viewing patterns for each five second segment.
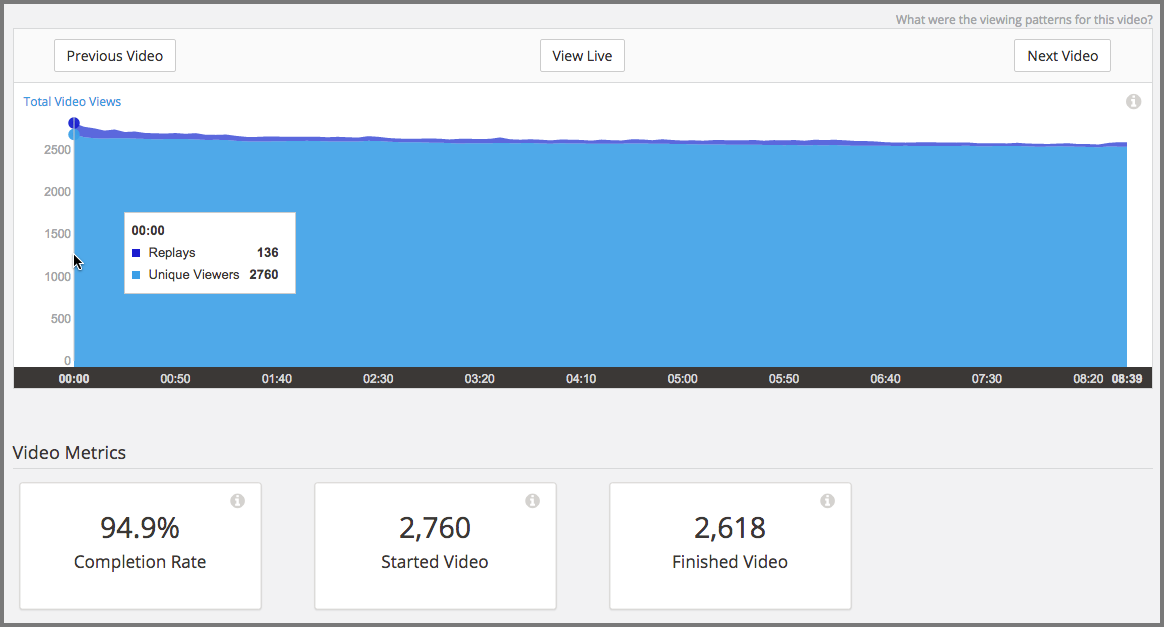
For some videos, the information that you get from Insights might be a valuable confirmation that your learners are engaged by the video content. For other videos, the information might raise questions about why learners replay a particular part of the video, or skip over a part of the video.
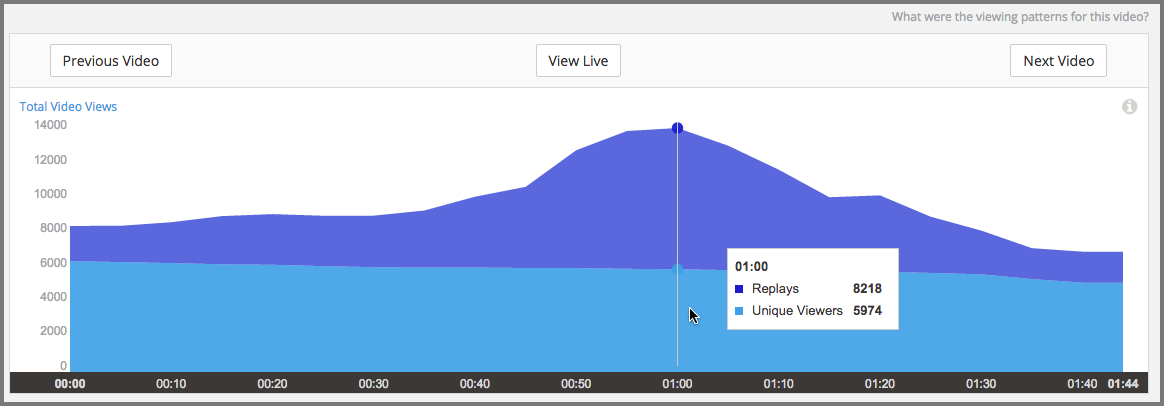
While you review data for a video in Insights, you can select View Live to open the video component in the LMS. Using the viewing patterns revealed by Insights, you can investigate specific segments of your course videos, and then make deductions about causes and take action.
For more information, see the Engagement with Course Videos section in the Using edX Insights guide.
23 September 2015
Performance improvements to edX Insights have made the sign-in process significantly faster.
25 August 2015
A new metric that measures total interest in your course over time is now available in edX Insights. The Enrollment Activity page now includes a metric for Total Enrollment (the number of learners who have ever been enrolled in the course) as well as for Current Enrollment (the number of learners enrolled as of the computation date, not including learners who have unenrolled).
For more information, see the Enrollment Activity section in the Using edX Insights guide.
6 August 2015
A new metric that measures total interest in your course over time is now available in edX Insights. The Enrollment Activity page now includes a metric for Total Enrollment (the number of learners who have ever been enrolled in the course) as well as for Current Enrollment (the number of learners enrolled as of the computation date, not including learners who have unenrolled).
For more information, see the Enrollment Activity section in the Using edX Insights guide.
23 June 2015
All Problem Parts Now Combined
Learner submissions for problems that have more than one part are now counted only once, for the entire problem, rather than once for each part of the problem. In courses that include problems with differing numbers of questions, or parts, in each problem, the resulting graph could be difficult to interpret.
For example, a course has an assignment that includes some problems with four parts, and other problems with only one part. The graph of the problem submissions for the assignment before this change appeared as follows.
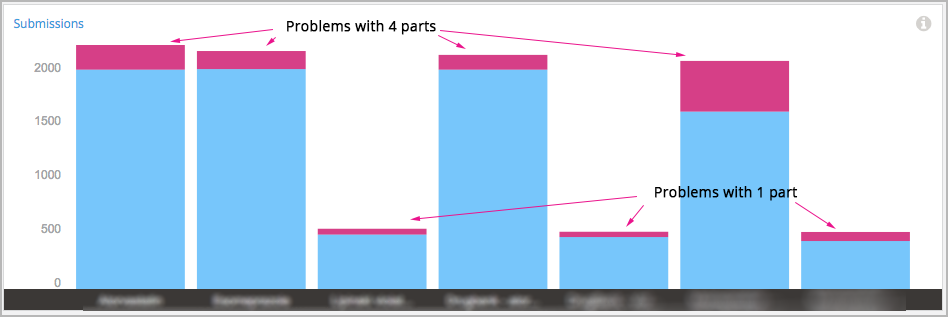
Now, with submissions for each problem counted once, the graph for the same assignment in the course appears as follows.

Per Problem Performance Data
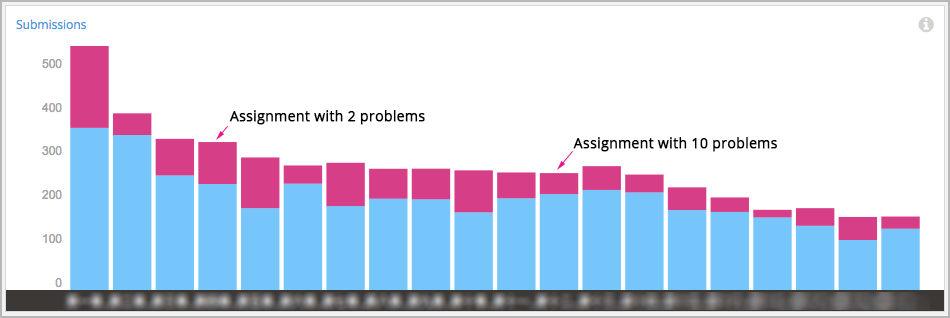
EdX Insights now makes it easier to see how many learners did well on assignments or on ungraded problems in course sections. In the performance graphs for graded content and ungraded problems, the number of correct and incorrect submissions received is now averaged by the number of problems.
Before this change was made, edX Insights presented totals rather than averages. In courses that include differing numbers of problems in each assignment, the resulting graph could be difficult to interpret.
For example, the first homework assignment in a course has four problems, the second has six problems, the third has five problems, and so on. The graph of the homework assignment submissions for the course before this change appeared as follows.

Now, with the change to average submissions by the number of problems in each assignment, the graph for the same course appears as follows.
9 April 2015
Course teams can now use edX Insights to access student performance data for both graded and ungraded exercises. The number of students who submitted an answer, and the percentage who submitted the correct or incorrect answer, is available at the section, subsection, and unit level. The actual answers that students submit for each ungraded question are also available for review.
For more information, see the new Ungraded Problem Submissions section in the Using edX Insights guide.
11 March 2015
In edX Insights, course teams can now review how students are answering graded problems. You can use the performance charts and reports to assess problem difficulty, identify common mistakes and misconceptions, and verify that your problems are clearly stated and complete.
For more information, see Student Performance in the Using edX Insights guide.
23 February 2015
Student engagement data reported by edX Insights now includes activity by students who used the edX Mobile app to watch videos on smartphones.
28 January 2015
The learner engagement data computed for edX Insights is now updated as soon as weekly computations are complete. Previously, updates were delayed by as much as 24 hours. (AN-4150)