CloudWatch
Grafana ships with built in support for CloudWatch. You just have to add it as a data source and you will be ready to build dashboards for you CloudWatch metrics.
Adding the data source
- Open the side menu by clicking the the Grafana icon in the top header.
-
In the side menu under the
Dashboardslink you should find a link namedData Sources.NOTE: If this link is missing in the side menu it means that your current user does not have the
Adminrole for the current organization. -
Click the
Add newlink in the top header. - Select
CloudWatchfrom the dropdown.
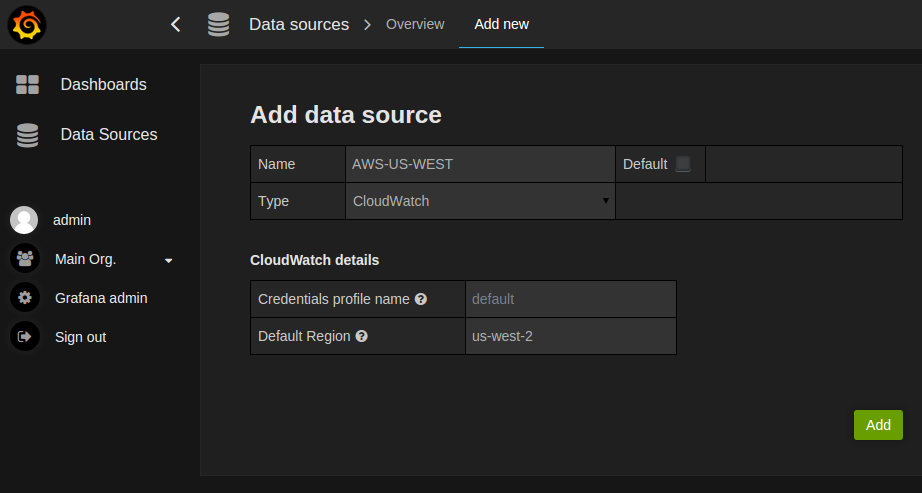
| Name | Description |
|---|---|
| Name | The data source name, important that this is the same as in Grafana v1.x if you plan to import old dashboards. |
| Default | Default data source means that it will be pre-selected for new panels. |
| Credentials profile name | Specify the name of the profile to use (if you use ~/aws/credentials file), leave blank for default. This option was introduced in Grafana 2.5.1 |
| Default Region | Used in query editor to set region (can be changed on per query basis) |
Authentication
IAM Roles
Currently all access to CloudWatch is done server side by the Grafana backend using the official AWS SDK. If you grafana server is running on AWS you can use IAM Roles and authentication will be handled automatically.
Checkout AWS docs on [IAM Roles]](http://docs.aws.amazon.com/AWSEC2/latest/UserGuide/iam-roles-for-amazon-ec2.html)
AWS credentials file
Create a file at ~/.aws/credentials. That is the HOME path for user running grafana-server.
Example content:
[default]
aws_access_key_id = asdsadasdasdasd
aws_secret_access_key = dasdasdsadasdasdasdsa
region = us-west-2
Metric Query Editor
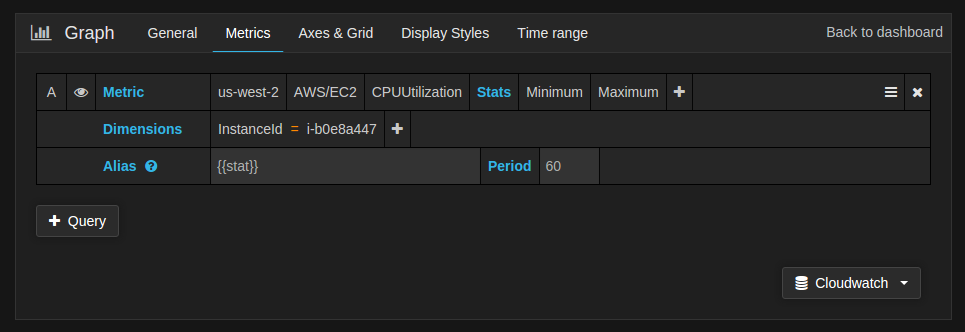
You need to specify a namespace, metric, at least one stat, and at least one dimension.
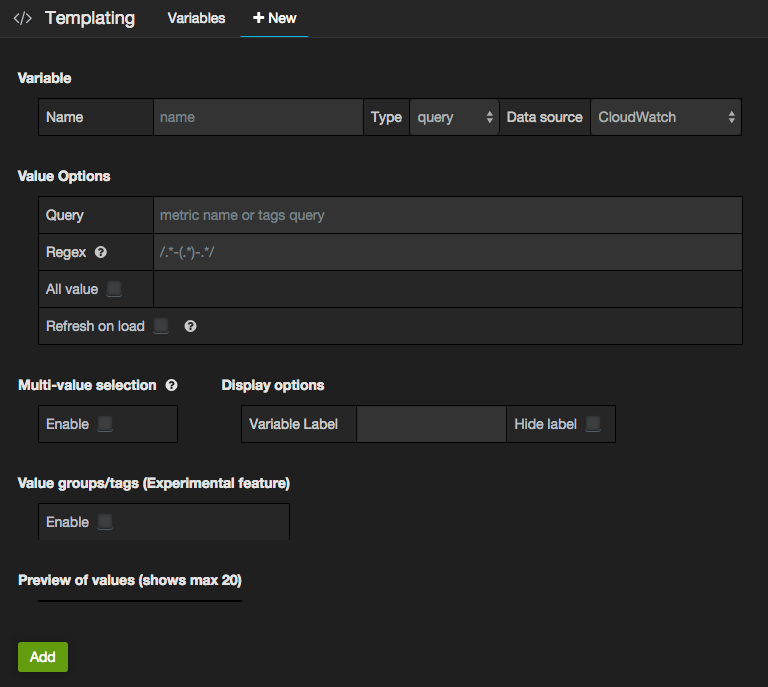
Templated queries
CloudWatch Datasource Plugin provides the following functions in Variables values query field in Templating Editor to query region, namespaces, metric names and dimension keys/values on the CloudWatch.
| Name | Description |
|---|---|
regions() |
Returns a list of regions AWS provides their service. |
namespaces() |
Returns a list of namespaces CloudWatch support. |
metrics(namespace) |
Returns a list of metrics in the namespace. |
dimension_keys(namespace) |
Returns a list of dimension keys in the namespace. |
dimension_values(region, namespace, metric, dimension_key) |
Returns a list of dimension values matching the specified region, namespace, metric and dimension_key. |
For details about the metrics CloudWatch provides, please refer to the CloudWatch documentation.
Cost
It's worth to mention that Amazon will charge you for CloudWatch API usage. CloudWatch costs $0.01 per 1,000 GetMetricStatistics or ListMetrics requests. For each query Grafana will issue a GetMetricStatistics request and every time you pick a dimension in the query editor Grafana will issue a ListMetrics request.