Export and Import
Exporting a dashboard
Dashboards are exported in Grafana JSON format, and contain everything you need (layout, variables, styles, data sources, queries, etc)to import the dashboard at a later time.
Export to file
To export a dashboard, locate the settings menu within the desired dashboard and click the gear icon. The export option will always be available, and will open a browser save-as dialog window.

Copy JSON
The raw JSON may be accessed directly from within the interface and copy/pasted into an editor of your choice to be saved later. To view this JSON, locate the settings menu within the desired dashboard and click the gear icon. The View JSON option will always be available, and will open the raw JSON in a text area. To copy the entire JSON file, click into the text area, the select all CTRL+A (PC, Linux) or ⌘+A (Mac).

Importing a dashboard
Grafana 2.0 now has integrated dashboard storage engine that can be configured to use an internal sqlite3 database, MySQL, or Postgres. This eliminates the need to use Elasticsearch for dashboard storage for Graphite users. Grafana 2.0 does not support storing dashboards in InfluxDB.
The import view can be found at the Dashboard Picker dropdown, next to the New Dashboard and Playlist buttons.
Import from a file
To import a dashboard through a local JSON file, click the 'Choose file' button in the Import from File section. Note that JSON is not linted or validated prior during upload, so we recommend validating locally if you're editing. In a pinch, you can use http://jsonlint.com/, and if you are editing dashboard JSON frequently, there are linter plugins for popular text editors.
Importing dashboards from Elasticsearch
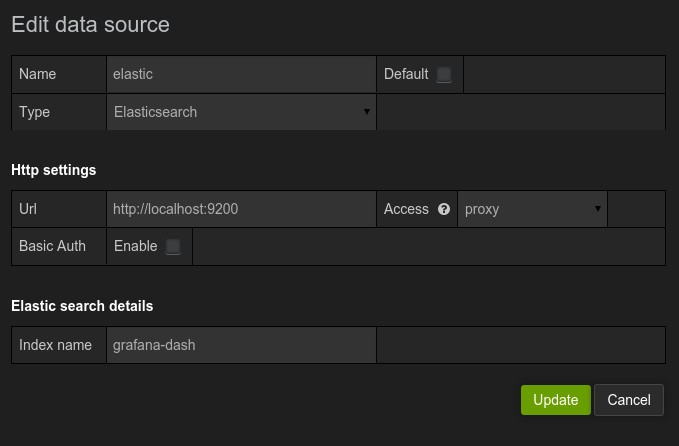
Start by going to the Data Sources view (via the side menu), and make sure your Elasticsearch data source is added. Specify the Elasticsearch index name where your existing Grafana v1.x dashboards are stored (the default is grafana-dash).
Importing dashboards from InfluxDB
Start by going to the Data Sources view (via the side menu), and make sure your InfluxDB data source is added. Specify the database name where your Grafana v1.x dashboards are stored, the default is grafana.
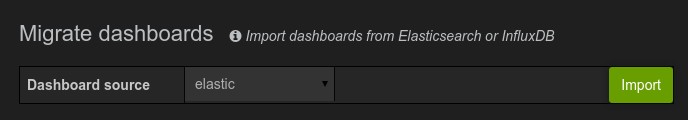
Import view
In the Import view you find the section Migrate dashboards. Pick the data source you added (from Elasticsearch or InfluxDB), and click the Import button.
Your dashboards should be automatically imported into the Grafana 2.0 back-end. Dashboards will no longer be stored in your previous Elasticsearch or InfluxDB databases.
Troubleshooting
Template variables could not be initialized.
When importing a dashboard, keep an eye out for template variables in your JSON that may not exist in your instance of Grafana. For example,
"templating": {
  "list": [
    {
      "allFormat": "glob",
      "current": {
        "tags": [],
        "text": "google_com + monkey_id_au",
        "value": [
          "google_com",
          "monkey_id_au"
        ]
      },
      "datasource": null,
To resolve this, remove any unnecessary JSON that may be specific to the instance you are exporting from. In this case, we can remove the entire "current" section entirely, and Grafana will populate default.
"templating": {
  "list": [
    {
      "allFormat": "glob",
      "datasource": null,