Table Panel
The new table panel is very flexible, supporting both multiple modes for time series as well as for table, annotation and raw JSON data. It also provides date formatting and value formatting and coloring options.
To view table panels in action and test different configurations with sample data, check out the Table Panel Showcase in the Grafana Playground.
Options overview
The table panel has many ways to manipulate your data for optimal presentation.
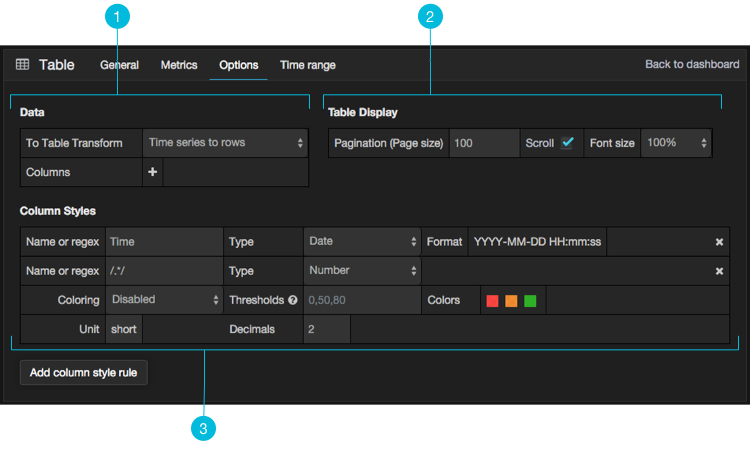
Data: Control how your query is transformed into a table.Table Display: Table display options.Column Styles: Column value formatting and display options.
Data to Table
The data section contains the To Table Transform (1). This is the primary option for how your data/metric query should be transformed into a table format. The Columns (2) option allows you to select what columns you want in the table. Only applicable for some transforms.
Time series to rows
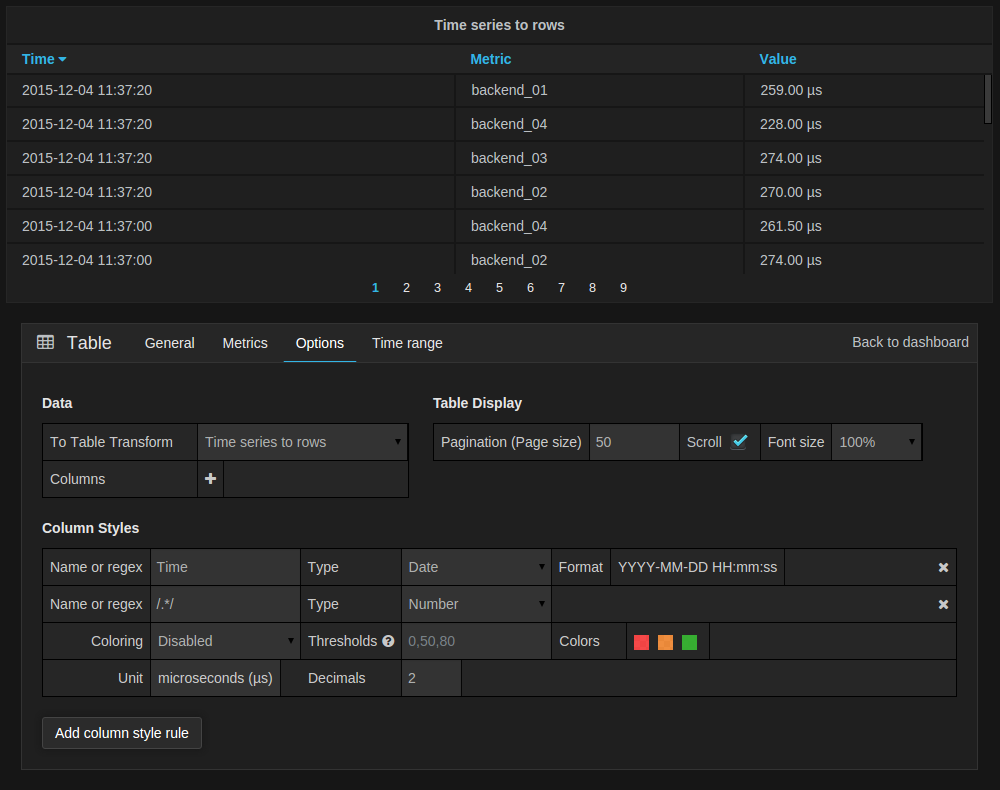
In the most simple mode you can turn time series to rows. This means you get a Time, Metric and a Value column. Where Metric is the name of the time series.
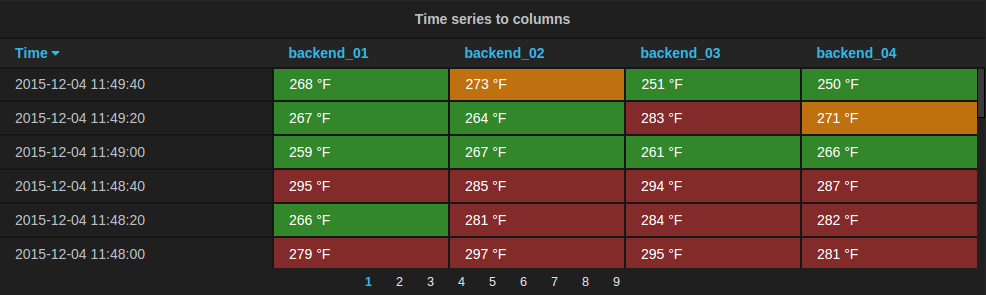
Time series to columns
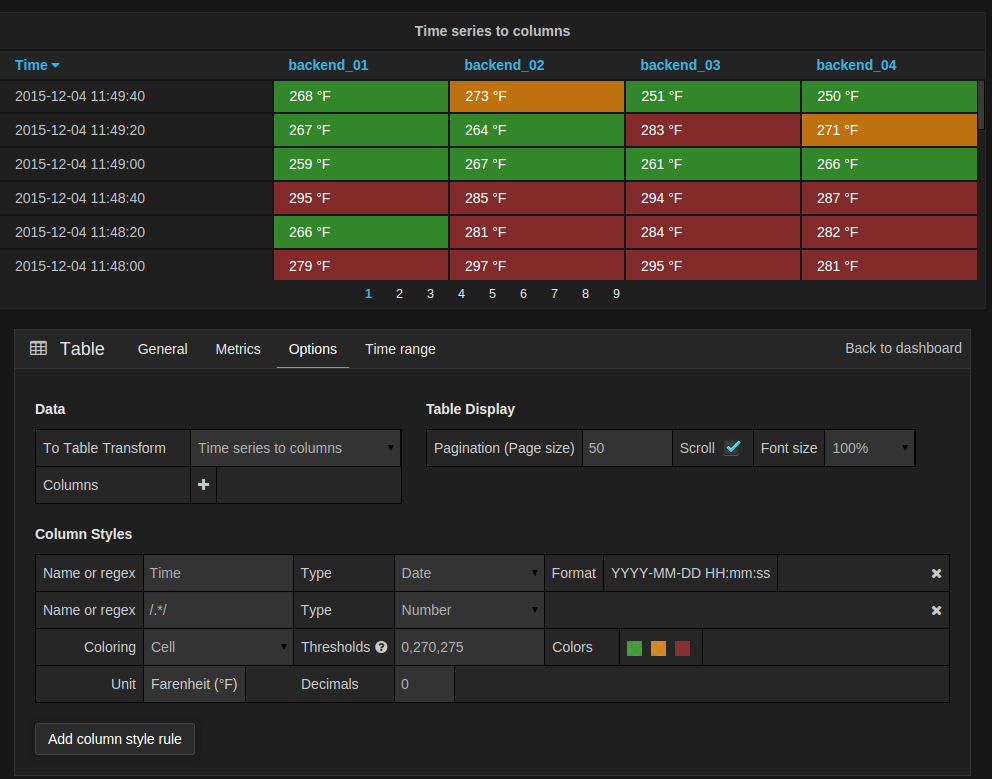
This transform allows you to take multiple time series and group them by time. Which will result in the primary column being Time and a column for each time series.
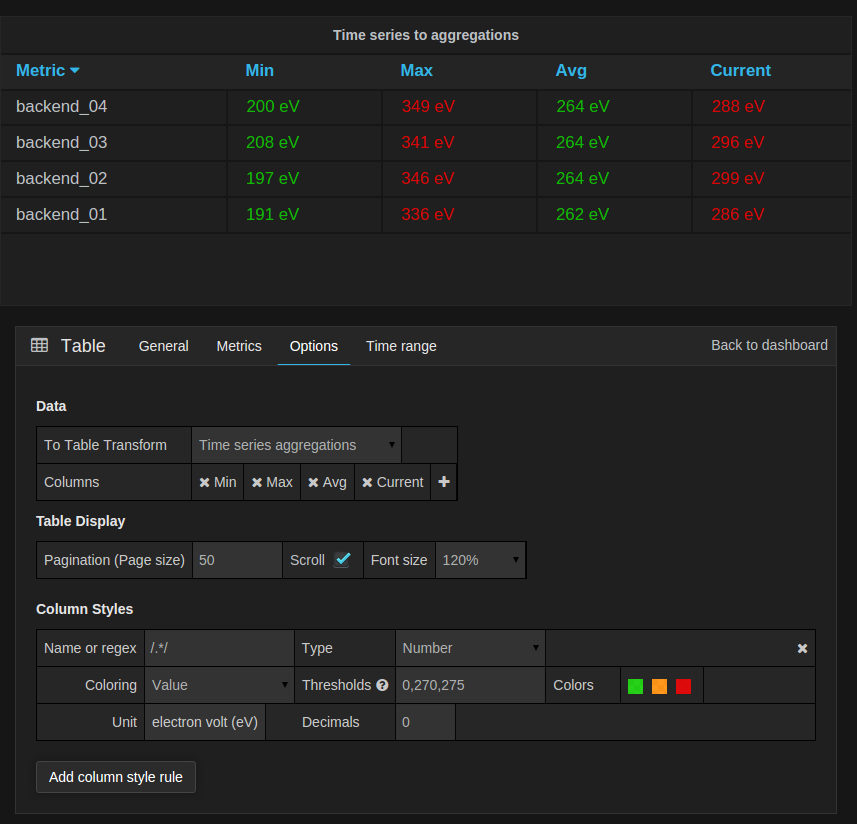
Time series aggregations
 This table transformation will lay out your table into rows by metric, allowing columns of
 Avg, Min, Max, Total, Current and Count. More than one column can be added.
Annotations
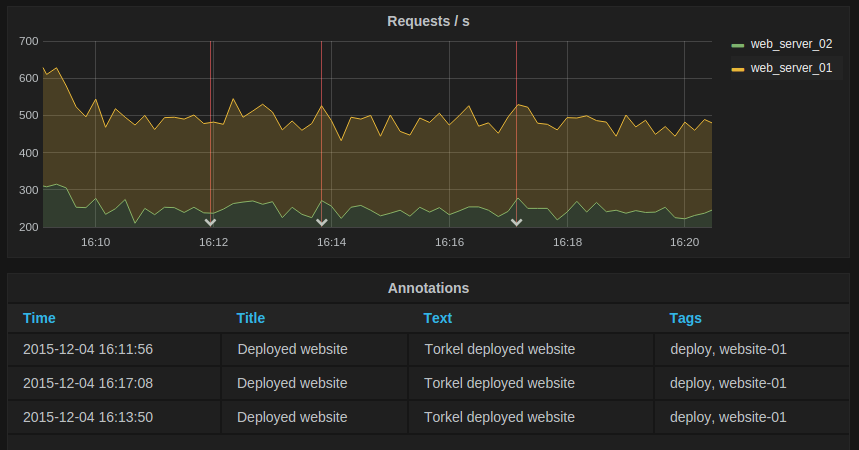
If you have annotations enabled in the dashboard you can have the table show them. If you configure this mode then any queries you have in the metrics tab will be ignored.
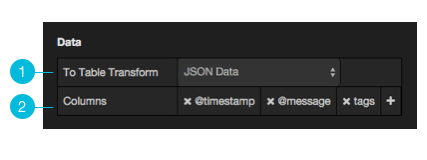
JSON Data
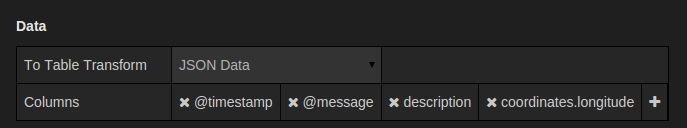
If you have an Elasticsearch Raw Document query or an Elasticsearch query without a date histogram use this
transform mode and pick the columns using the Columns section.
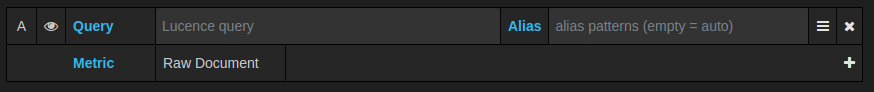
Table Display
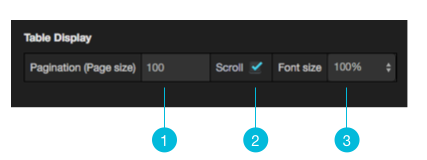
Pagination (Page Size): The table display fields allow you to control ThePagination(page size) is the threshold at which the table rows will be broken into pages. For example, if your table had 95 records with a pagination value of 10, your table would be split across 9 pages.Scroll: Thescroll barcheckbox toggles the ability to scroll within the panel, when unchecked, the panel height will grow to display all rows.Font Size: Thefont sizefield allows you to increase or decrease the size for the panel, relative to the default font size.
Column Styles
The column styles allow you control how dates and numbers are formatted.

Name or regex: The Name or Regex field controls what columns the rule should be applied to. The regex or name filter will be matched against the column name not against column values.Type: The three supported types of types areNumber,StringandDate.Format: Specify date format. Only available whenTypeis set toDate.ColoringandThresholds: Specify color mode and thresholds limits.UnitandDecimals: Specify unit and decimal precision for numbers.Add column style rule: Add new column rule.