Migrating from v1.x to v2.x
Grafana 2.0 represents a major update to Grafana. It brings new capabilities, many of which are enabled by its new back-end server and integrated database.
The new back-end lays a solid foundation that we hope to build on over the coming months. For the 2.0 release, it enables authentication as well as server-side sharing and rendering.
We've attempted to provide a smooth migration path for v1.9 users to migrate to Grafana 2.0.
Adding Data sources
The config.js file has been deprecated. Data sources are now managed via
the UI or HTTP API. Manage your
organizations data sources by clicking on the Data Sources menu on the
side menu (which can be toggled via the Grafana icon in the upper left
of your browser).
From here, you can add any Graphite, InfluxDB, elasticsearch, and OpenTSDB data sources that you were using with Grafana 1.x. Grafana 2.0 can be configured to communicate with your data source using a back-end mode which can eliminate many CORS-related issues, as well as provide more secure authentication to your data sources.
Note When you add your data sources please name them exactly as you named them in
config.jsin Grafana 1.x. That name is referenced by panels, annotation and template queries. That way when you import your old dashboard they will work without any changes.
Importing your existing dashboards
Grafana 2.0 now has integrated dashboard storage engine that can be configured to use an internal sqlite3 database, MySQL, or Postgres. This eliminates the need to use Elasticsearch for dashboard storage for Graphite users. Grafana 2.0 does not support storing dashboards in InfluxDB.
You can seamlessly import your existing dashboards.
Importing dashboards from Elasticsearch
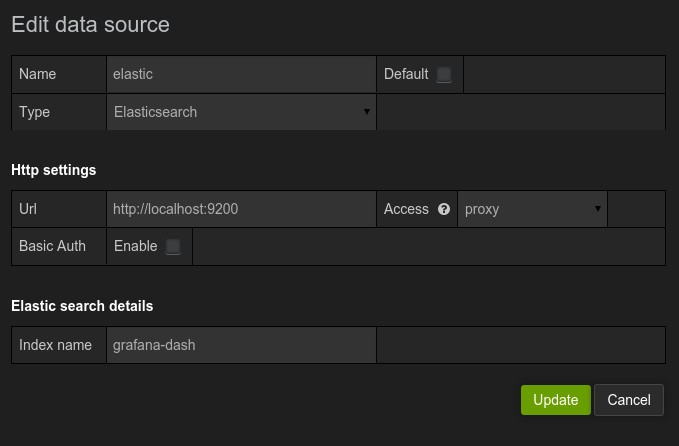
Start by going to the Data Sources view (via the side menu), and make
sure your Elasticsearch data source is added. Specify the Elasticsearch
index name where your existing Grafana v1.x dashboards are stored
(the default is grafana-dash).

Importing dashboards from InfluxDB
Start by going to the Data Sources view (via the side menu), and make
sure your InfluxDB data source is added. Specify the database name where
your Grafana v1.x dashboards are stored, the default is grafana.
Go to Import dashboards view
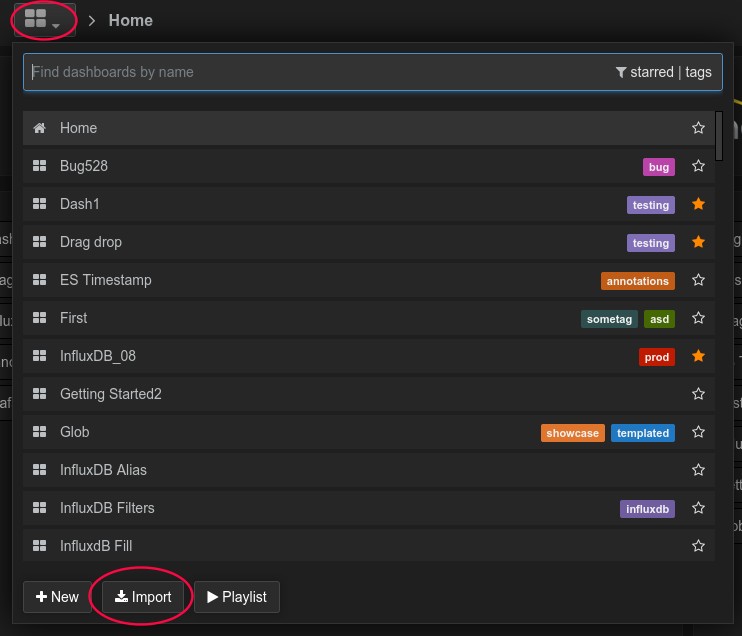
Go to the Dashboards view and click on the dashboards search drop
down. Click the Import button at the bottom of the search drop down.

Import view
In the Import view you find the section Migrate dashboards. Pick the
data source you added (from Elasticsearch or InfluxDB), and click the
Import button.

Your dashboards should be automatically imported into the Grafana 2.0 back-end.
Dashboards will no longer be stored in your previous Elasticsearch or InfluxDB databases.
Invite your team
Explain users and orgs.