Dashlist Panel
Overview
The dashboard list panel allows you to display dynamic links to other dashboards. The list can be configured to use starred dashboards, a search query and/or dashboard tags.

On each dashboard load, the dashlist panel will re-query the dashboard list, always providing the most up to date results.
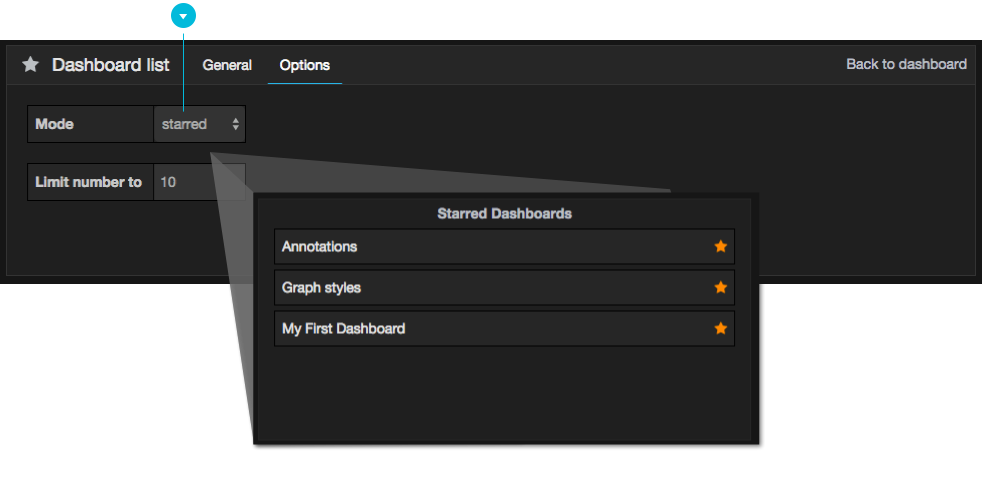
Mode: Starred Dashboards
The starred dashboard selection displays starred dashboards, up to the number specified in the Limit Number to field, in alphabetical order. On dashboard load, the dashlist panel will re-query the favorites to appear in dashboard list panel, always providing the most up to date results.

Mode: Search Dashboards
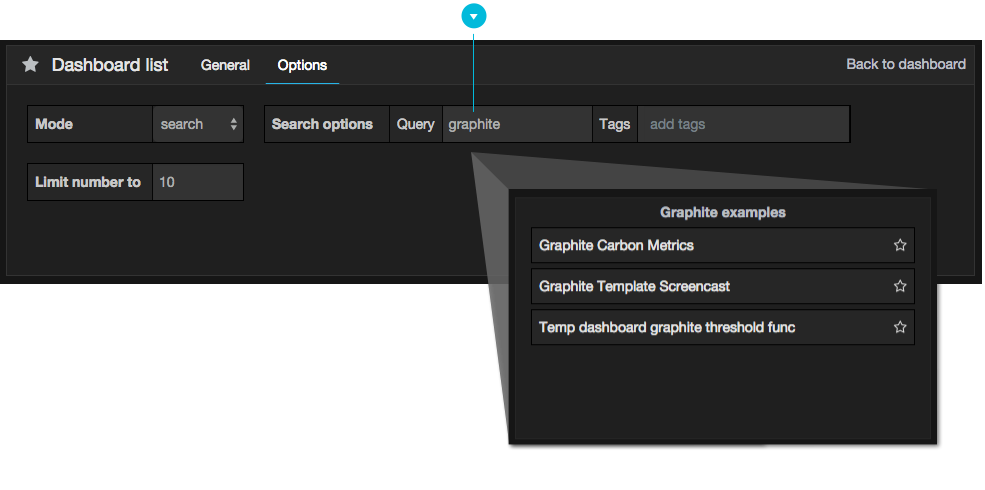
The panel may be configured to search by either string query or tag(s). On dashboard load, the dashlist panel will re-query the dashboard list, always providing the most up to date results.
To configure dashboard list in this manner, select search from the Mode select box. When selected, the Search Options section will appear.
| Name | Description |
|---|---|
| Mode | Set search or starred mode |
| Query | If in search mode specify the search query |
| Tags | if in search mode specify dashboard tags to search for |
| Limit number to | Specify the maximum number of dashboards |
Search by string
To search by a string, enter a search query in the Search Options: Query field. Queries are case-insensitive, and partial values are accepted.

Search by tag
To search by one or more tags, enter your selection in the Search Options: Tags: field. Note that existing tags will not appear as you type, and are case sensitive. To see a list of existing tags, you can always return to the dashboard, open the Dashboard Picker at the top and click tags link in the search bar.

When multiple tags and strings appear, the dashboard list will display those matching ALL conditions.