KairosDB Guide
Grafana v2.1 brings initial support for KairosDB Datasources. While the process of adding the datasource is similar to adding a Graphite or OpenTSDB datasource type, Kairos DB does have a few different options for building queries.
Adding the data source to Grafana
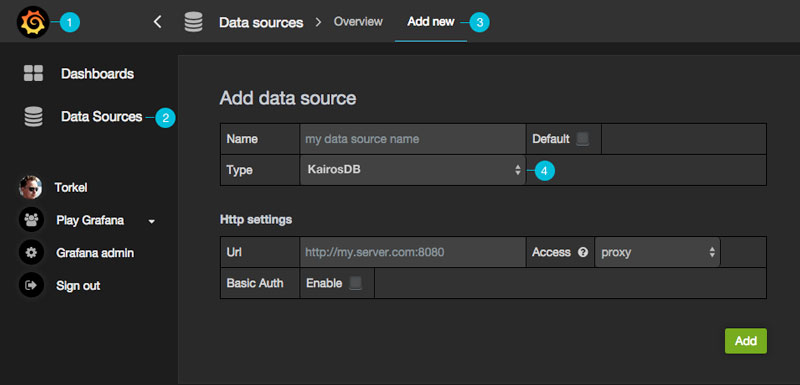
- Open the side menu by clicking the the Grafana icon in the top header.
-
In the side menu under the
Dashboardslink you should find a link namedData Sources.NOTE: If this link is missing in the side menu it means that your current user does not have the
Adminrole for the current organization. -
Click the
Add newlink in the top header. - Select
KairosDBfrom the dropdown.
| Name | Description |
|---|---|
| Name | The data source name, important that this is the same as in Grafana v1.x if you plan to import old dashboards. |
| Default | Default data source means that it will be pre-selected for new panels. |
| Url | The http protocol, ip and port of your kairosdb server (default port is usually 8080) |
| Access | Proxy = access via Grafana backend, Direct = access directory from browser. |
Query editor
Open a graph in edit mode by click the title.

For details on KairosDB metric queries checkout the official. - Query Metrics - KairosDB 0.9.4 documentation.
Templated queries
KairosDB Datasource Plugin provides following functions in Variables values query field in Templating Editor to query metric names, tag names, and tag values to kairosdb server.
| Name | Description | ||
|---|---|---|---|
metrics(query) |
Returns a list of metric names matching query. If nothing is given, returns a list of all metric names. |
||
tag_names(query) |
Returns a list of tag names matching query. If nothing is given, returns a list of all tag names. |
||
tag_values(metric,tag) |
Returns a list of values for tag from the given metric. |
For details of metric names, tag names, and tag values, please refer to the KairosDB documentations.