Sharing features
Grafana provides a number of ways to share a dashboard or a specific panel to other users within your organization. It also provides ways to publish interactive snapshots that can be accessed by external partners.
Share dashboard
Share a dashboard via the share icon in the top nav. This opens the share dialog where you can get a link to the current dashboard with the current selected time range and template variables. If you have made changes to the dashboard, make sure those are saved before sending the link.
Dashboard snapshot
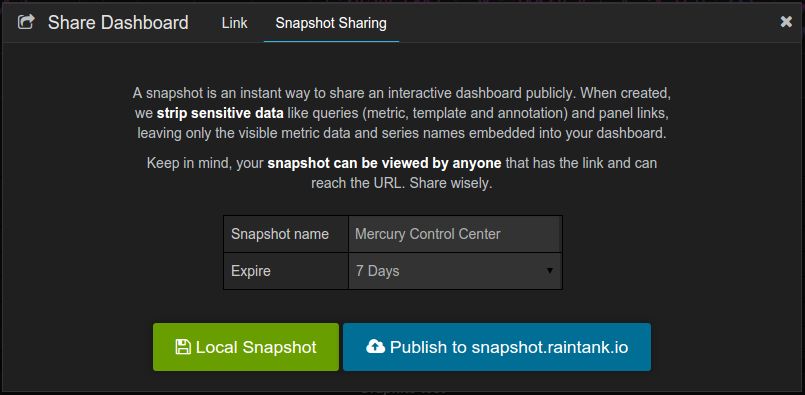
A dashboard snapshot is an instant way to share an interactive dashboard publicly. When created, we strip sensitive data like queries (metric, template and annotation) and panel links, leaving only the visible metric data and series names embedded into your dashboard. Dashboard snapshots can be accessed by anyone who has the link and can reach the URL.

Publish snapshots
You can publish snapshots to you local instance or to snapshot.raintank.io. The later is a free service that is provided by Raintank that allows you to publish dashboard snapshots to an external grafana instance. The same rules still apply, anyone with the link can view it. You can set an expiration time if you want the snapshot to be removed after a certain time period.
Share Panel
Click a panel title to open the panel menu, then click share in the panel menu to open the Share Panel dialog. Here you
have access to a link that will take you to exactly this panel with the current time range and selected template variables.
You also get a link to service side rendered PNG of the panel. Useful if you want to share an image of the panel.
Please note that for OSX and Windows, you will need to ensure that a phantomjs binary is available under vendor/phantomjs/phantomjs. For Linux, a phantomjs binary is included - however, you should ensure that any requisite libraries (e.g. libfontconfig) are available.
Embed Panel
You can embed a panel using an iframe on another web site. This tab will show you the html that you need to use.
Example:
<iframe src="http://snapshot.raintank.io/dashboard/solo/snapshot/UtvRYDv650fHOV2jV5QlAQhLnNOhB5ZN?panelId=4&fullscreen&from=1427385145990&to=1427388745990" width="650" height="300" frameborder="0"></iframe>
Below there should be an interactive Grafana graph embedded in an iframe: