Troubleshooting
This page is dedicated to helping you solve any problem you have getting
Grafana to work. Please review it before opening a new GitHub
issue or asking a
question in the #grafana IRC channel on freenode.
General connection issues
When setting up Grafana for the first time you might experience issues with Grafana being unable to query Graphite, OpenTSDB or InfluxDB. You might not be able to get metric name completion or the graph might show an error like this:
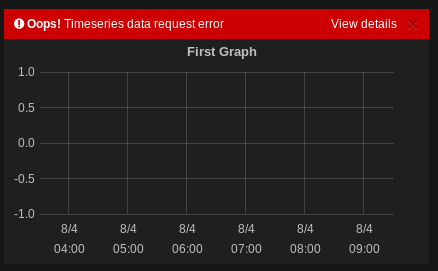
For some types of errors, the View details link will show you error
details. For many types of HTTP connection errors, however, there is very
little information. The best way to troubleshoot these issues is use
the Chrome developer tools.
By pressing F12 you can bring up the chrome dev tools.
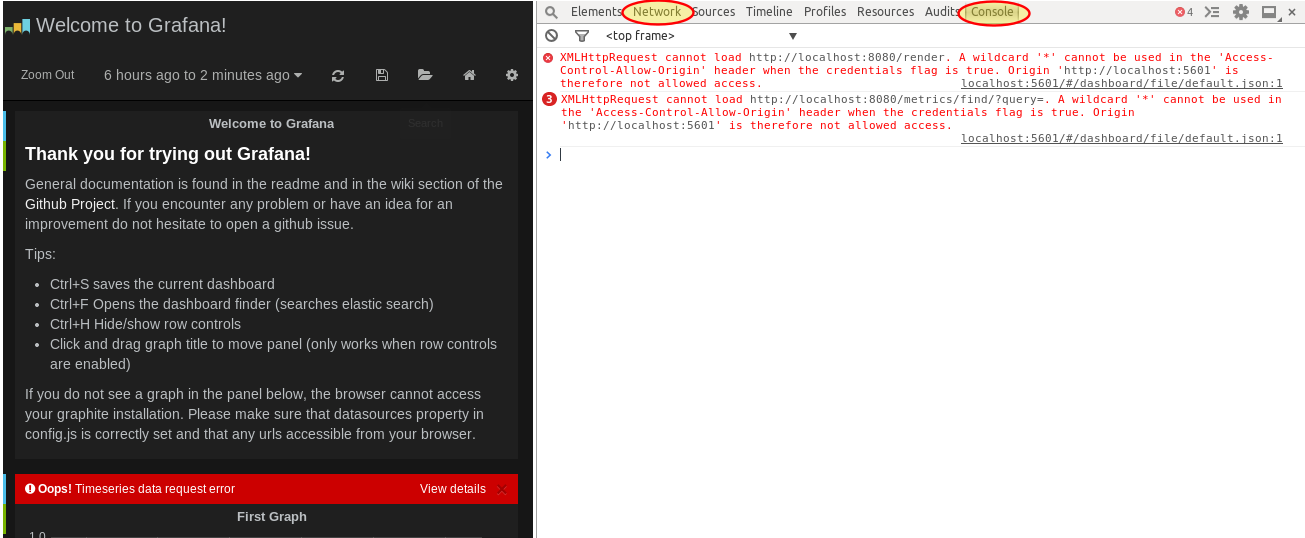
There are two important tabs in the Chrome developer tools: Network
and Console. The Console tab will show you Javascript errors and
HTTP request errors. In the Network tab you will be able to identify the
request that failed and review request and response parameters. This
information will be of great help in finding the cause of the error.
If you are unable to solve the issue, even after reading the remainder
of this troubleshooting guide, you should open a GitHub support
issue. Before you do that
please search the existing closed or open issues. Also if you need to
create a support issue, screen shots and or text information about the
chrome console error, request and response information from the
Network tab in Chrome developer tools are of great help.
Inspecting Grafana metric requests
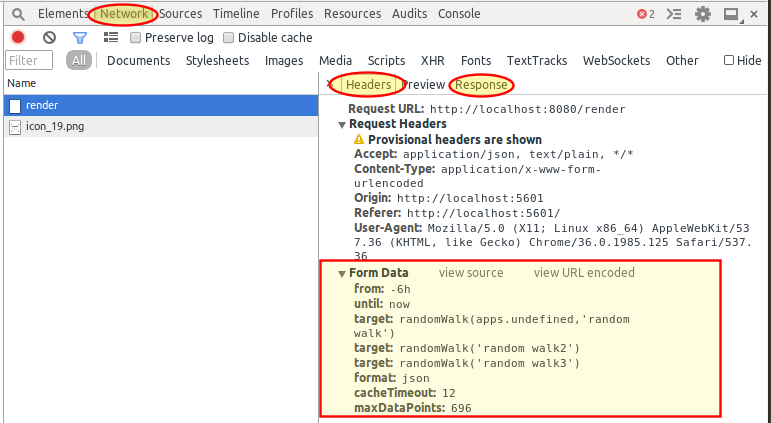
After opening the Chrome developer tools for the first time the
Network tab is empty. You will need to refresh the page to get
requests to show. For some type of errors, especially CORS-related,
there might not be a response at all.
Graphite connection issues
If your Graphite web server is on another domain or IP address from your Grafana web server you will need to setup CORS (Cross Origin Resource Sharing).
You know if you are having CORS-related issues if you get an error like this in the Chrome developer tools:
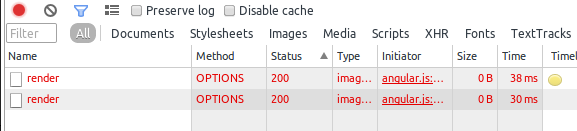
If the request failed on method OPTIONS then you need to review your
Graphite web server configuration.
Only blank white page
When you load Grafana and all you get is a blank white page then you
probably have a Javascript syntax error in config.js. In the Chrome
developer tools console you will quickly identify the line of the syntax
error.