Graphite
Grafana has an advanced Graphite query editor that lets you quickly navigate the metric space, add functions, change function parameters and much more. The editor can handle all types of graphite queries. It can even handle complex nested queries through the use of query references.
Adding the data source

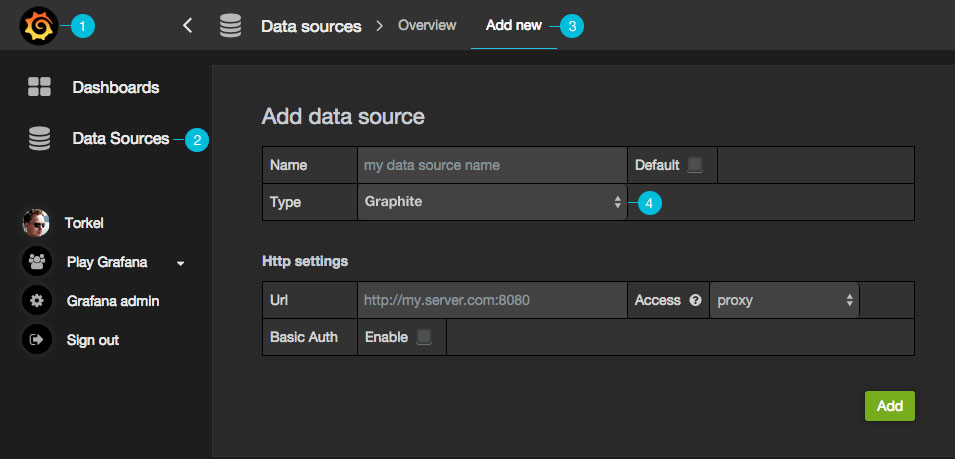
- Open the side menu by clicking the the Grafana icon in the top header.
-
In the side menu under the
Dashboardslink you should find a link namedData Sources.NOTE: If this link is missing in the side menu it means that your current user does not have the
Adminrole for the current organization. -
Click the
Add newlink in the top header. - Select
Graphitefrom the dropdown.
| Name | Description |
|---|---|
| Name | The data source name, important that this is the same as in Grafana v1.x if you plan to import old dashboards. |
| Default | Default data source means that it will be pre-selected for new panels. |
| Url | The http protocol, ip and port of you graphite-web or graphite-api install. |
| Access | Proxy = access via Grafana backend, Direct = access directory from browser. |
Proxy access means that the Grafana backend will proxy all requests from the browser, and send them on to the Data Source. This is useful because it can eliminate CORS (Cross Origin Site Resource) issues, as well as eliminate the need to disseminate authentication details to the Data Source to the browser.
Direct access is still supported because in some cases it may be useful to access a Data Source directly depending on the use case and topology of Grafana, the user, and the Data Source.
Metric editor
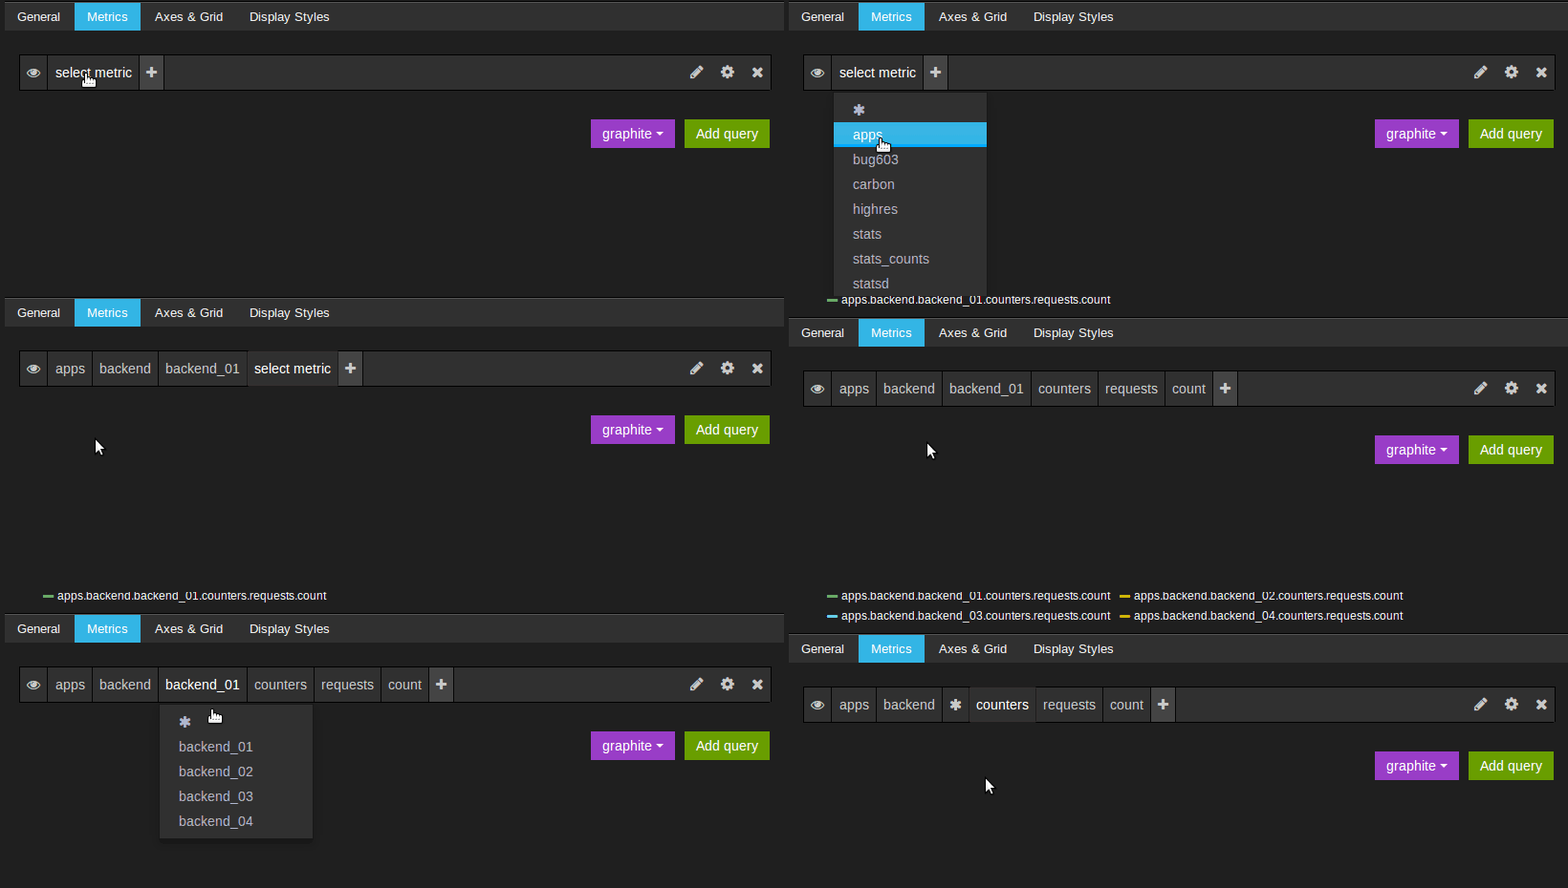
Navigate metric segments
Click the Select metric link to start navigating the metric space. One you start you can continue using the mouse
or keyboard arrow keys. You can select a wildcard and still continue.

Functions
Click the plus icon to the right to add a function. You can search for the function or select it from the menu. Once a function is selected it will be added and your focus will be in the text box of the first parameter. To later change a parameter just click on it and it will turn into a text box. To delete a function click the function name followed by the x icon.

Optional parameters
Some functions like aliasByNode support an optional second argument. To add this parameter specify for example 3,-2 as the first parameter and the function editor will adapt and move the -2 to a second parameter. To remove the second optional parameter just click on it and leave it blank and the editor will remove it.

Point consolidation
All Graphite metrics are consolidated so that Graphite doesn't return more data points than there are pixels in the graph. By default
this consolidation is done using avg function. You can how Graphite consolidates metrics by adding the Graphite consolidateBy function.
Notice This means that legend summary values (max, min, total) cannot be all correct at the same time. They are calculated client side by Grafana. And depending on your consolidation function only one or two can be correct at the same time.
Templating
You can create a template variable in Grafana and have that variable filled with values from any Graphite metric exploration query. You can then use this variable in your Graphite queries, either as part of a metric path or as arguments to functions.
For example a query like prod.servers.* will fill the variable with all possible
values that exists in the wildcard position.
You can also create nested variables that use other variables in their definition. For example
apps.$app.servers.* uses the variable $app in its query definition.

Query Reference
You can reference queries by the row “letter” that they’re on (similar to Microsoft Excel). If you add a second query to graph, you can reference the first query simply by typing in #A. This provides an easy and convenient way to build compounded queries.