Service-Specific Instructions for Streaming Application Logs
Page last updated: July 15, 2015
This topic provides instructions for configuring some third-party log management services.
Once you have configured a service, refer to the Third-Party Log Management Services topic for instructions on binding your application to the service.
Papertrail
From your Papertrail account:
Click Add System.
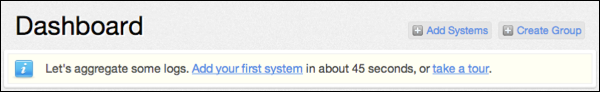
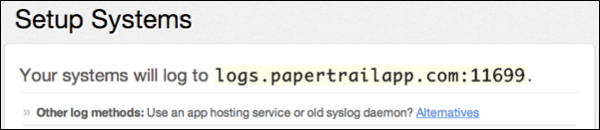
Click the Alternatives link.
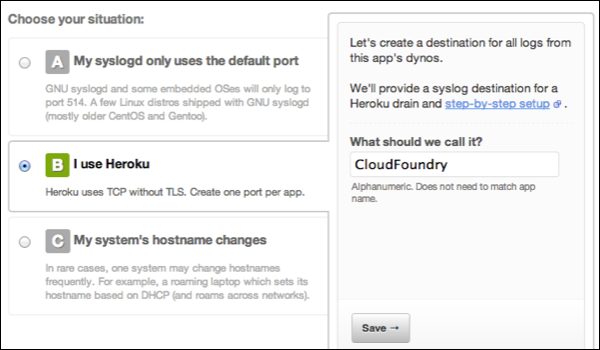
Select I use Heroku, enter a name, and click Save.
Record the URL with port that is displayed after creating the system.

Create the log drain service in Cloud Foundry.
$ cf cups my-logs -l syslog://logs.papertrailapp.com:PORTBind the service to an app. Restage or push the app using either the
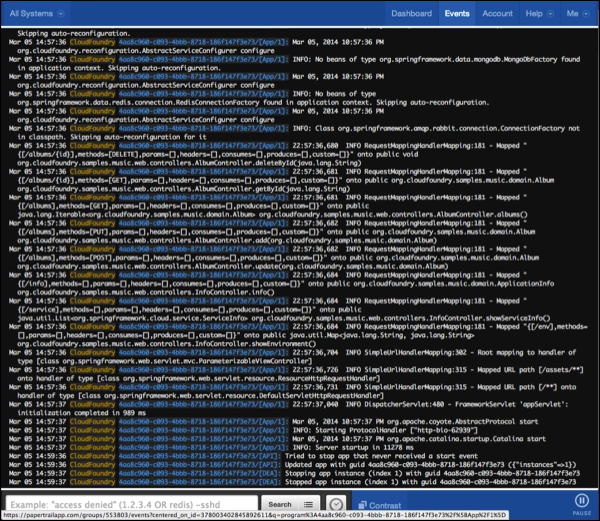
cf restage APPLICATION-NAMEorcf push APPLICATION-NAMEcommand. After a short delay, logs begin to flow automatically.Once Papertrail starts receiving log entries, the view automatically updates to the logs viewing page.
Splunk
See Streaming Application Logs to Splunk for details.
Splunk Storm
From your Splunk Storm account:
Click Add project.
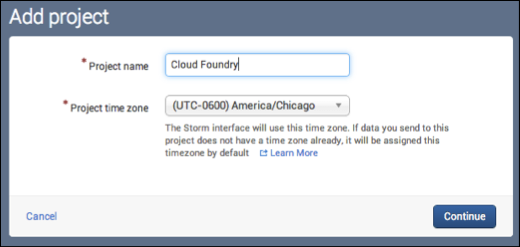
Enter the project details.
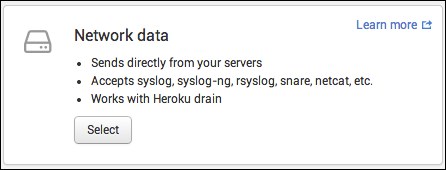
Create a new input for Network data.
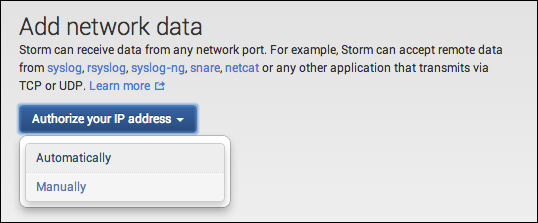
Manually enter the external IP addresses your Cloud Foundry administrator assigns to outbound traffic. If you are using Pivotal Web Services, refer to the Externally Visible IP Addresses topic.
Note the host and port provided for TCP input.
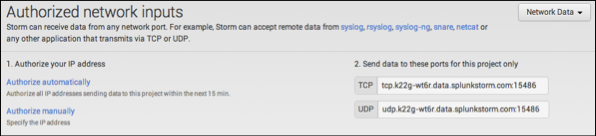
Create the log drain service in Cloud Foundry using the displayed TCP host and port.
$ cf cups my-logs -l syslog://HOST:PORTBind the service to an app. Restage or push the app using either the
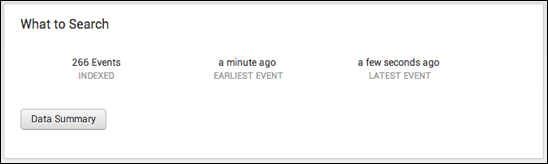
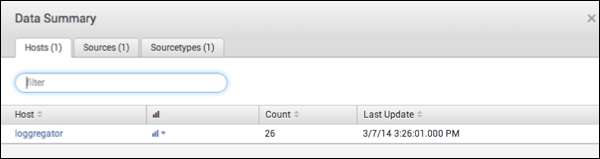
cf restage APPLICATION-NAMEorcf push APPLICATION-NAMEcommand. After a short delay, logs begin to flow automatically.Wait for some events to appear, then click Data Summary.
Click the loggregator link to view all incoming log entries from Cloud Foundry.
SumoLogic
Note: SumoLogic uses HTTPS for communication. HTTPS is supported in Cloud Foundry v158 and above.
From your SumoLogic account:
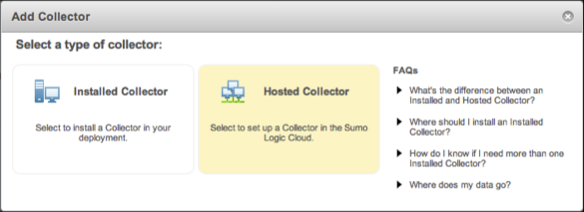
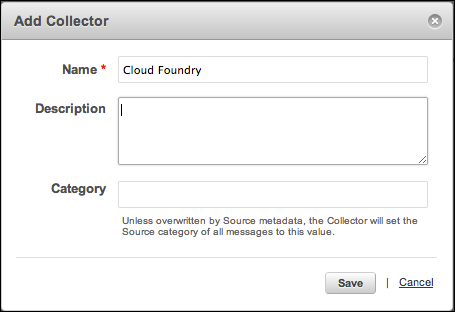
Click the Add Collector link.

Choose Hosted Collector and fill in the details.
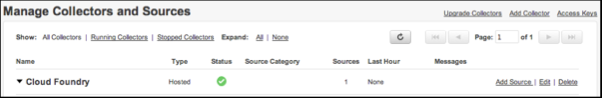
In the new collector’s row of the collectors view, click the Add Source link.
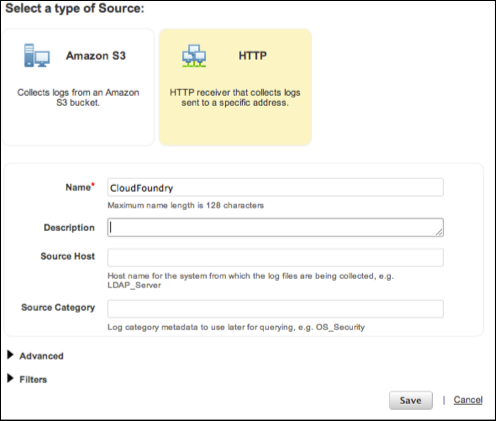
Select HTTP source and fill in the details.
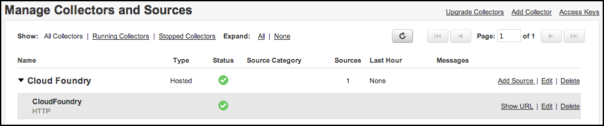
Once the source is created, a URL should be displayed. You can also view the URL by clicking the Show URL link beside the created source.
Create the log drain service in Cloud Foundry using the displayed URL.
$ cf cups my-logs -l HTTP-SOURCE-URLBind the service to an app. Restage or push the app using either the
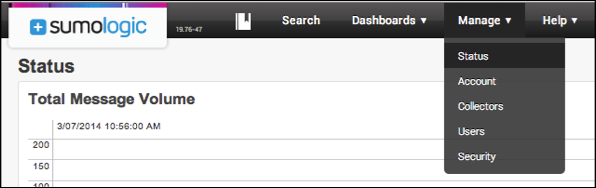
cf restage APPLICATION-NAMEorcf push APPLICATION-NAMEcommand. After a short delay, logs begin to flow automatically.In the SumoLogic dashboard, click Manage, then click Status to see a view of log messages received over time.
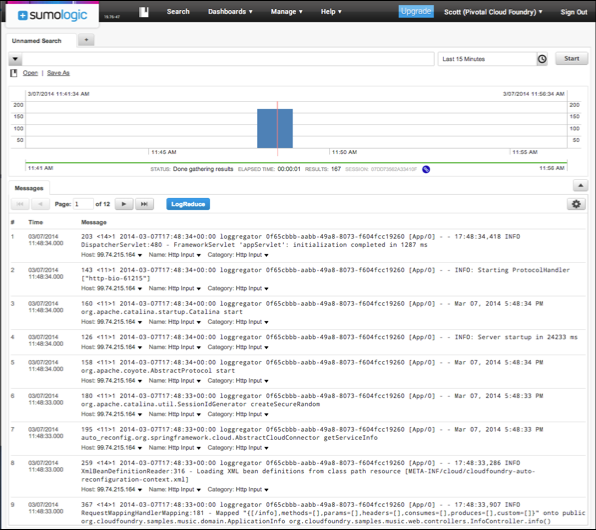
In the SumoLogic dashboard, click on Search. Place the cursor in the search box, then press Enter to submit an empty search query.
Logentries is Not Supported
Cloud Foundry distributes log messages over multiple servers in order to handle load. Currently, we do not recommend using Logentries as it does not support multiple syslog sources.