Overview of the Loggregator System
Page last updated: November 6, 2015
Loggregator is the next generation system for aggregating and streaming logs and metrics from all of the user apps and system components in a Cloud Foundry deployment.
Using Loggregator
The main use cases are as follows:
App developers can tail their application logs or dump the recent logs from the CF CLI, or stream these to a third party log archive and analysis service.
Operators and administrators can access the Loggregator Firehose, the combined stream of logs from all apps, plus metrics data from CF components.
Operators can deploy ‘nozzles’ to the Firehose. A nozzle is a component that listens to the Firehose for specified events and metrics and streams this data to external services.
Loggregator Components
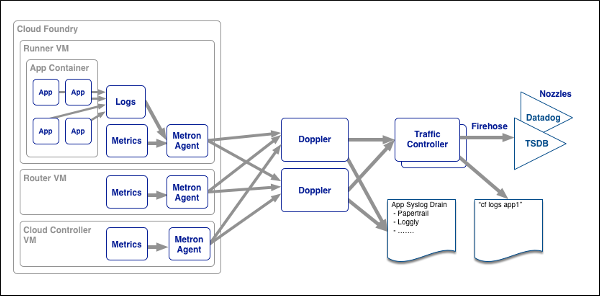 Overview of Loggregator components
Source
Sources are logging agents that run on the Cloud Foundry components.
Metron
Metron agents are co-located with sources. They collect logs and forward them to the Doppler servers.
Doppler
Dopplers gather logs from the Metron agents, store them in temporary buffers, and forward them to the Traffic Controller or to third party syslog drains.
Traffic Controller
Handles client requests for logs. Gathers and collates messages from all Doppler servers, and provides external API and message translation (as needed for legacy APIs). Exposes the Firehose.
Firehose
The Firehose is a websocket endpoint which streams all the event data coming from a Cloud Foundry deployment. The data stream includes logs, HTTP events and container metrics from all applications, and metrics from all Cloud Foundry system components. Logs from system components such as Cloud Controller are not included in the firehose and are typically accessed via rsyslog configuration.
Because the data coming from the Firehose may contain sensitive information, such as customer information in the application logs, the Firehose is only accessible by users who have the right permissions.
The Traffic Controller serves the Firehose over websocket at the /firehose endpoint. The events coming out of the Firehose are formatted as protobuf messages conforming to the dropsonde protocol.
The address of the traffic controller can be discovered by hitting the info endpoint on the API and getting the value of the doppler_logging_endpoint.
Example output for a BOSH Lite CF environment:
 $ cf curl /v2/info | jq .doppler_logging_endpoint
 wss://doppler.10.244.0.34.xip.io:443
Nozzles
Nozzles are programs which consume data from the Loggregator Firehose. Nozzles can be configured to select, buffer, and transform data, and forward it to other applications and services. For example:
- The Datadog nozzle publishes metrics coming from the Firehose to Datadog.
- The Syslog nozzle filters out log messages coming from the Firehose and sends it to a syslog server.
See our Nozzle Tutorial.