Troubleshooting Applications
Page last updated: April 16, 2015
Tracking Down an Application by CPU Usage
Applications do not always functions as designed. If you notice a sharp decrease in available staging VMs or an unanticipated increase in CPU, disk utilization, or memory utilization across the VMs in your deployment, use the following steps to determine if a specific application is at fault.
Run
bosh sshto open a secure shell into the DEA node that is experiencing the unexpected high resource usage.Install the htop interactive process viewer. In a terminal window, run
htopto launch the application.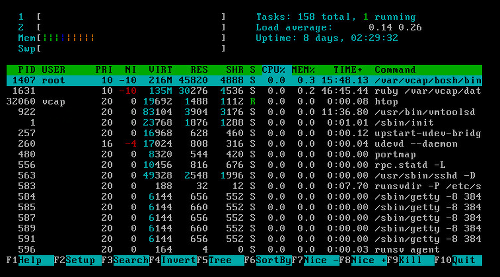
Press the
F6key and use the arrow keys to sort the htop output by the “TIME+” column. Processes using excessive resources display a TIME+ value significantly greater than other processes. Note the names of each of these processes.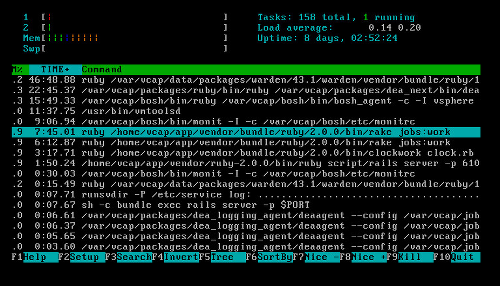
Press the
F5key to view all the processes as a tree.Press the
/key to search by the name of the processes. Locate the names of any processes found to be using excessive resources. Note thewshdcommand above each of these processes. Each of thesewshdcommands is a Warden handle for an application.In this example, the
wshdcommand is17vg99ooo1n: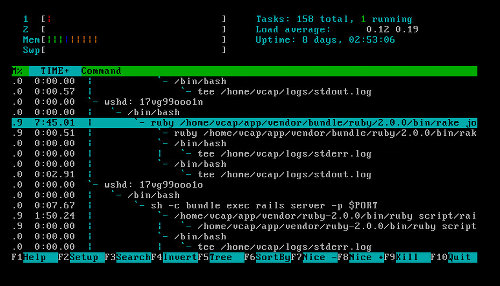
Press the
F10key to exithtop.Run
sudo su -to enter the root environment with root privileges.Search
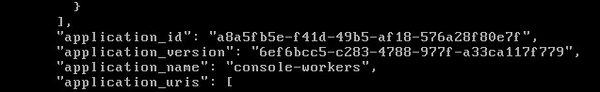
/var/vcap/data/dea_next/db/instances.jsonto find the Warden handles identified usinghtop. The JSON object containing a Warden handle also contains the application GUID and name.In this example, the JSON object containing the Warden handle
17vg99ooo1nalso contains the application GUIDa8a5fb5e-f41d-49b5-af18-576a28f80e7fand nameconsole-workers.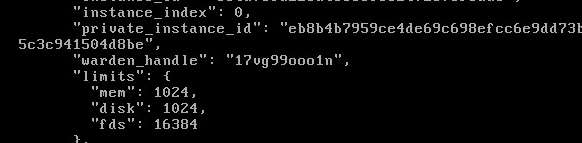
Accessing a Warden Container
Cloud Foundry runs each application in an isolated environment called a Warden container. When troubleshooting an issue with an application, you might want direct access to the Warden container running the application.
To access a Warden container:
Run
bosh sshto open a secure shell into the DEA node containing the application you want to troubleshoot.Use the process described in Tracking Down an Application by CPU Usage to find the Warden handle for the application.
On the DEA node, use the following command to open an interactive shell in the Warden container running your application:
/var/vcap/packages/warden/warden/src/wsh/wsh --socket /var/vcap/data/warden/depot/WARDEN-HANDLE/run/wshd.sock --user vcap
$ /var/vcap/packages/warden/warden/src/wsh/wsh --socket /var/vcap/data/warden/depot/17vg99ooo1n/run/wshd.sock --user vcap

password for vcap: ********
Logged into vcap@17vg99ooo1n
$
Preserving a Warden Container
By default, a Warden container exists only as long as the application it runs exists. If an application consistently crashes while starting, you might not be able to access the Warden container running the application without changing this default behavior.
To keep a Warden container from being deleted even when the application it runs
has stopped, set the container_grace_time parameter in the Warden linux.yml file to ~.
---
server:
  container_klass: Warden::Container::Linux

  container_grace_time: ~

  unix_domain_permissions: 0777
  . . .
Monitoring NATS Message Bus Traffic
To help troubleshoot an issue with an application, you can monitor NATS message bus traffic related to the application. To do this:
Run
cf targetto target the space containing the application.Run
cf app APPLICATION-NAME --guidto show the GUID of the application.$ cf app my-new-app --guid 0a709d5b-0d9b-400b-900a-81594583b634
Run
bosh sshto open a secure shell into a NATS node.Run
nats-sub -s "nats://${NATS_USERNAME}:${NATS_PASSWORD}@${NATS_HOST}:${NATS_PORT}" ">" | grep APPLICATION-GUIDto subscribe to NATS and show messages related to the application.
Viewing the HM9000 Data Store
The HM9000 data store contains information about every VM and application in a deployment. Reviewing this data store can provide insights into the state of a Cloud Foundry deployment as an aid to troubleshooting.
Use the following processes to view the contents of the HM9000 data store.
- Run
bosh ssh hm9000_z1/0to open a secure shell into the HM9000 VM. - Run
/var/vcap/packages/hm9000/hm9000 dump --config=/var/vcap/jobs/hm9000/config.json > /tmp/hm9000ds. This command outputs the data store into a text file,/tmp/hm9000ds.