Custom metrics dashboards have two primary use cases:
- Displaying different metrics from those in the standard metrics dashboard
- Customizing the layout of the metrics from the standard metrics dashboard
If either you want to display different metrics from those in the standard metrics dashboard or you want to change the layout of the dashboard then it will be necessary to create a custom metrics dashboard.
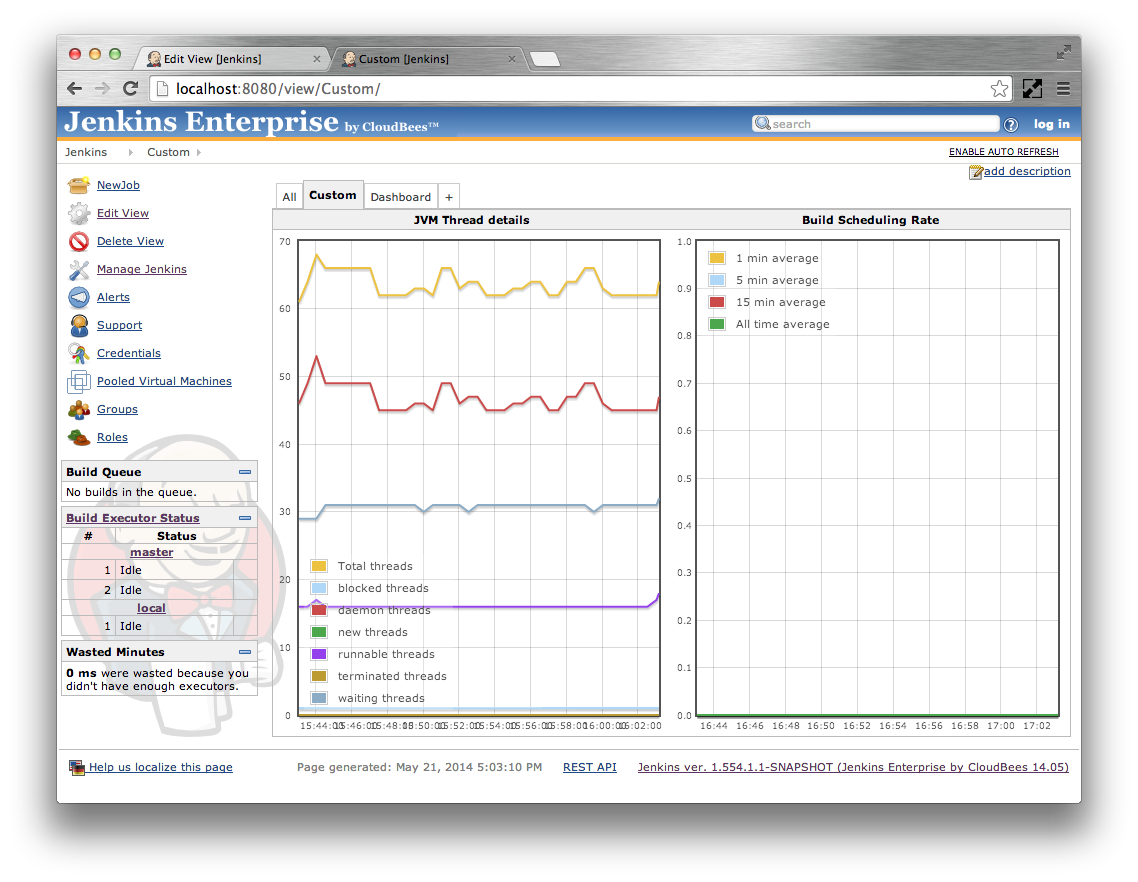
The following instructions will add a custom metrics dashboard view to the root of Jenkins. You can also add the dashboard to folders or other view container, though as the dashboard is not contextual the same information will be displayed. The dashboard will consist of a single row with two graphs:
- A graph showing the total number of threads in the JVM as well as a breakdown by thread state
- A graph showing build scheduling rate as per the standard metrics dashboard
The procedure is as follows:
If your Jenkins instance has some jobs, just click on the
+tab on the top of the jobs list in Jenkins to get to the new view screenIf your Jenkins does not have any jobs yet, change the browser URL from
JENKINS_URL/toJENKINS_URL/newView- Enter a name for your new view, such as
Custom. Select the Custom Metrics view (Single Jenkins) radio button.
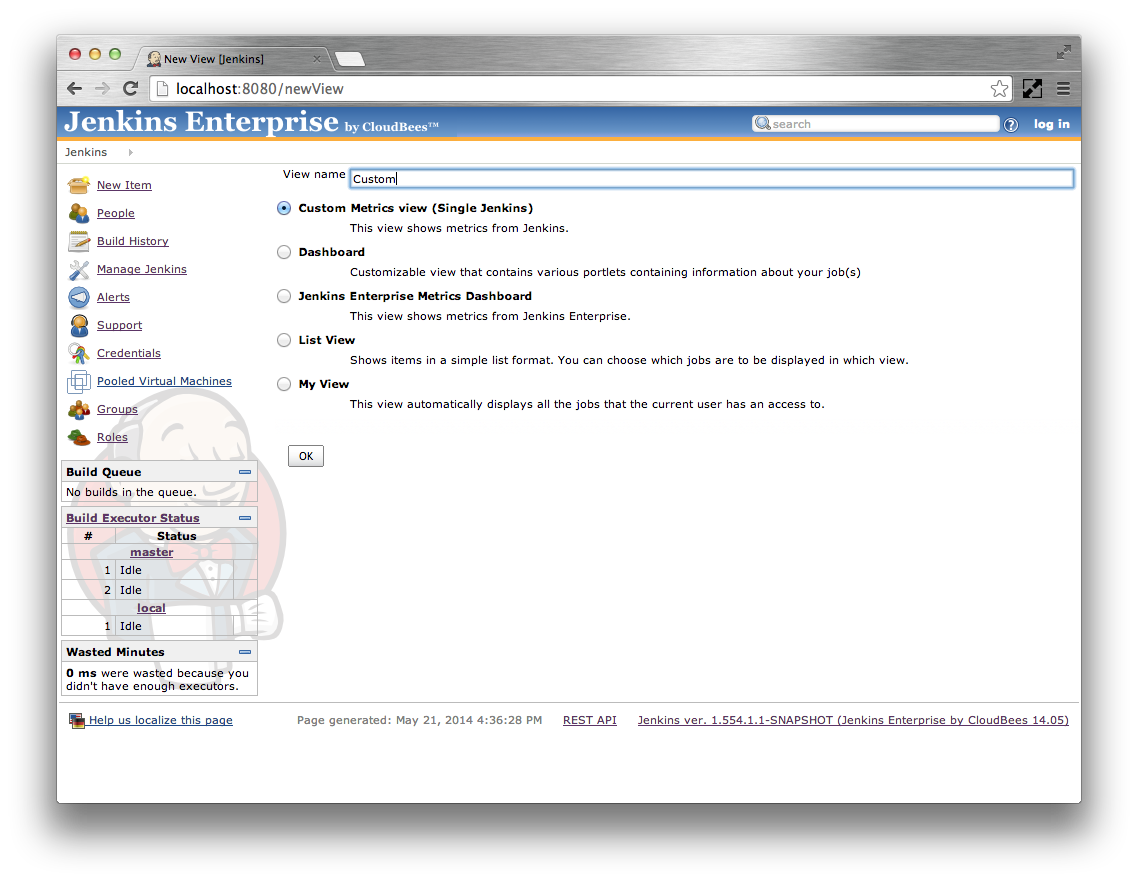
- Click on the
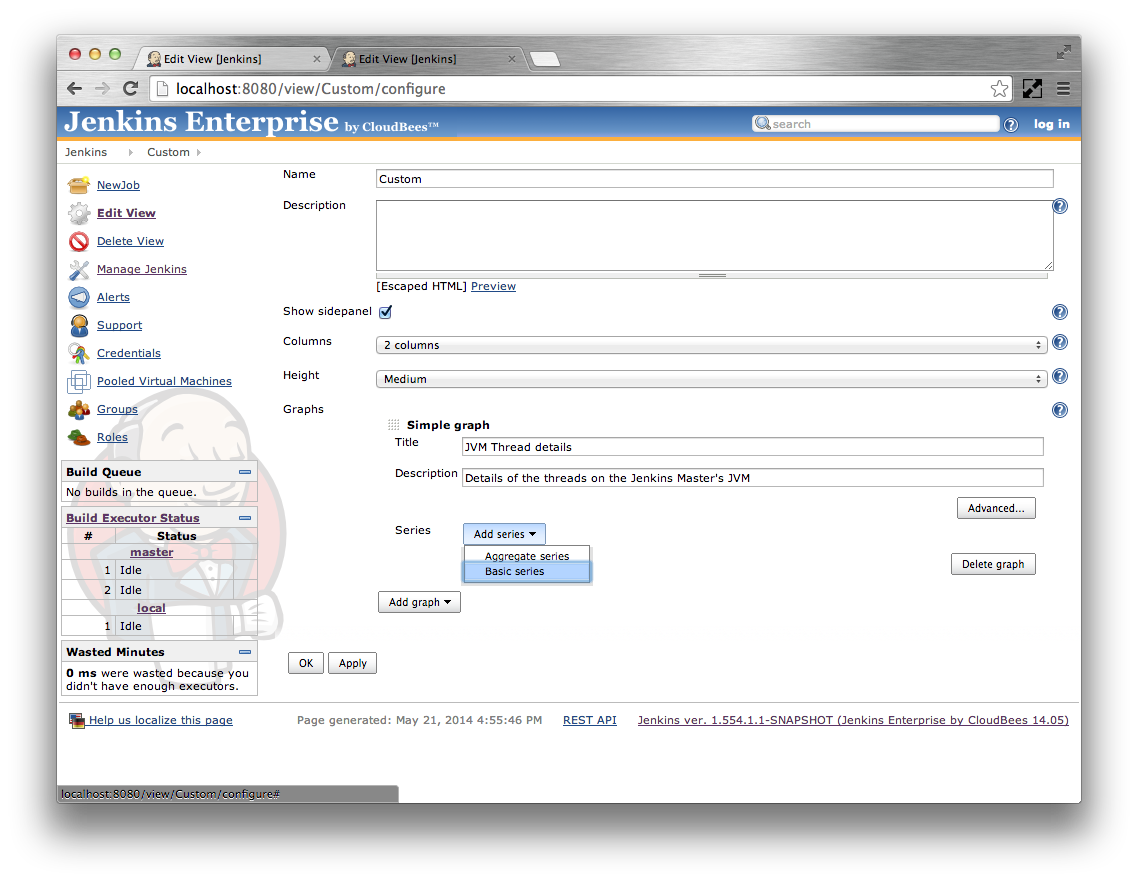
Okbutton. The view configuration screen should be displayed. Enable the Show sidepanel checkbox. Select 2 columns and a Medium height
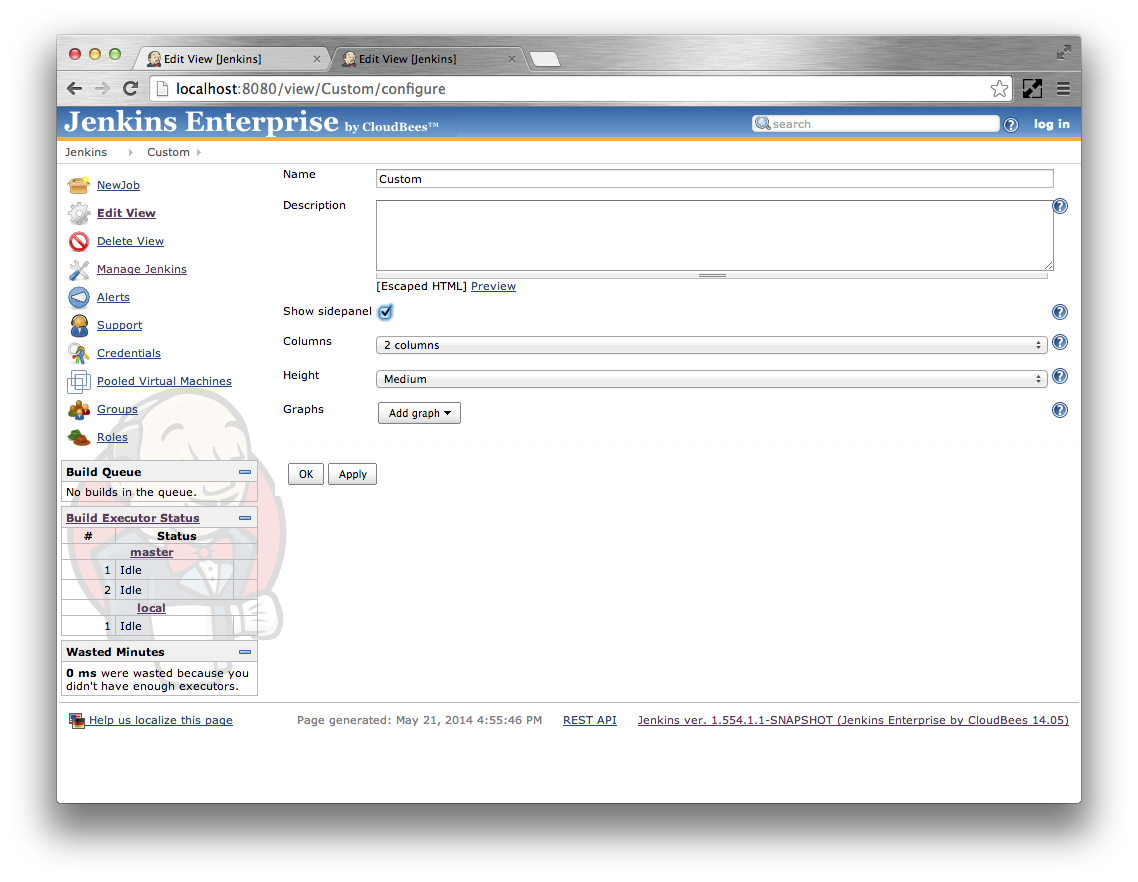
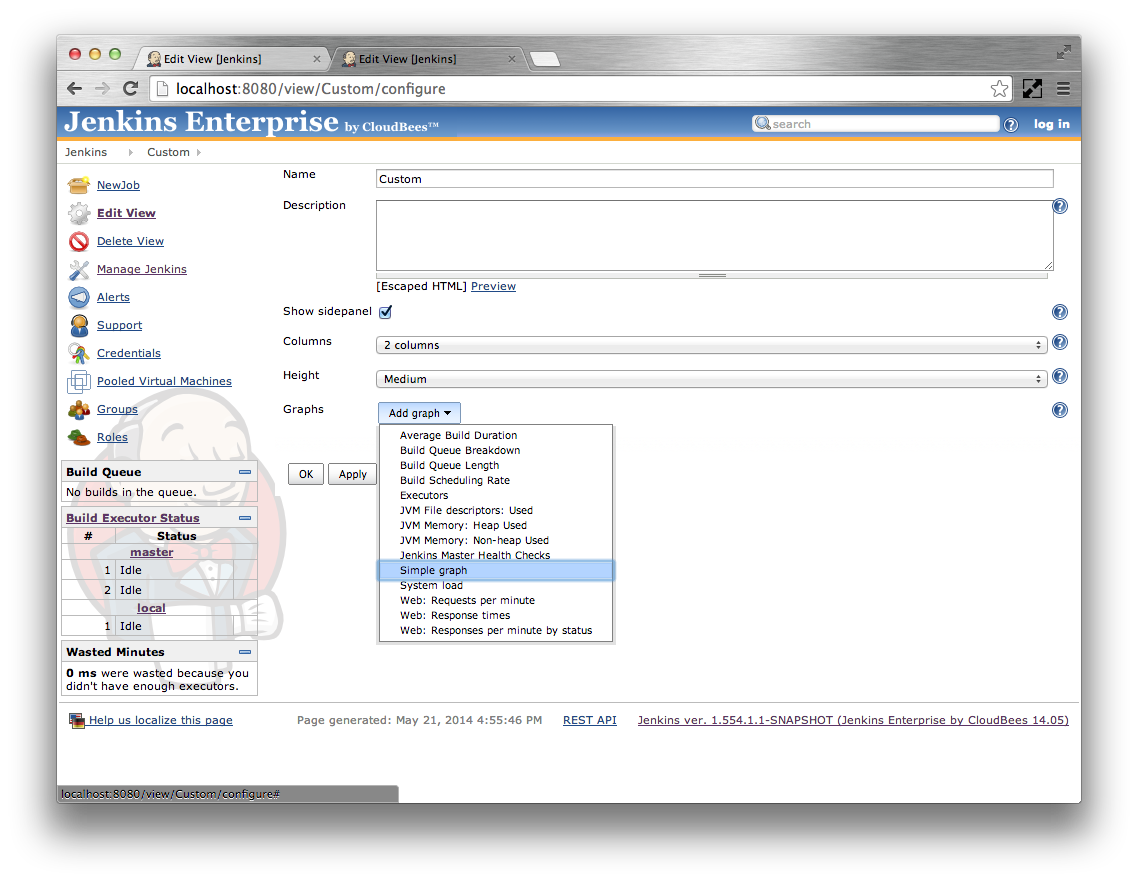
Click the Add graph button and select the Simple graph option. This corresponds to a simple customizable graph. Most of the other graph types are pre-canned graphs.
Configure the graph Title as
JVM Thread details. The Description is used as the tool tip for the graphs. The Advanced options allow configuring whether the graph should be drawn using lines, points, bars or a combination of thereof.Click the Add series and select Basic series
Select the Path as
vm.count. The Type should be auto-populated. In the situation where there are multiple metric types at the same path, the drop down can be used to select the correct metric type. The Metric allows selecting the specific metric to plot. For gauges such asvm.countthere is only one metric. See the section called “Standard metrics” for a description of the different metric types and the metrics they record. The Operation is only relevant when there are multiple metric sources, in Jenkins Enterprise there is only ever one source and this option can be ignored. The Label is the label to use on the graph’s legend, e.g.Total threads.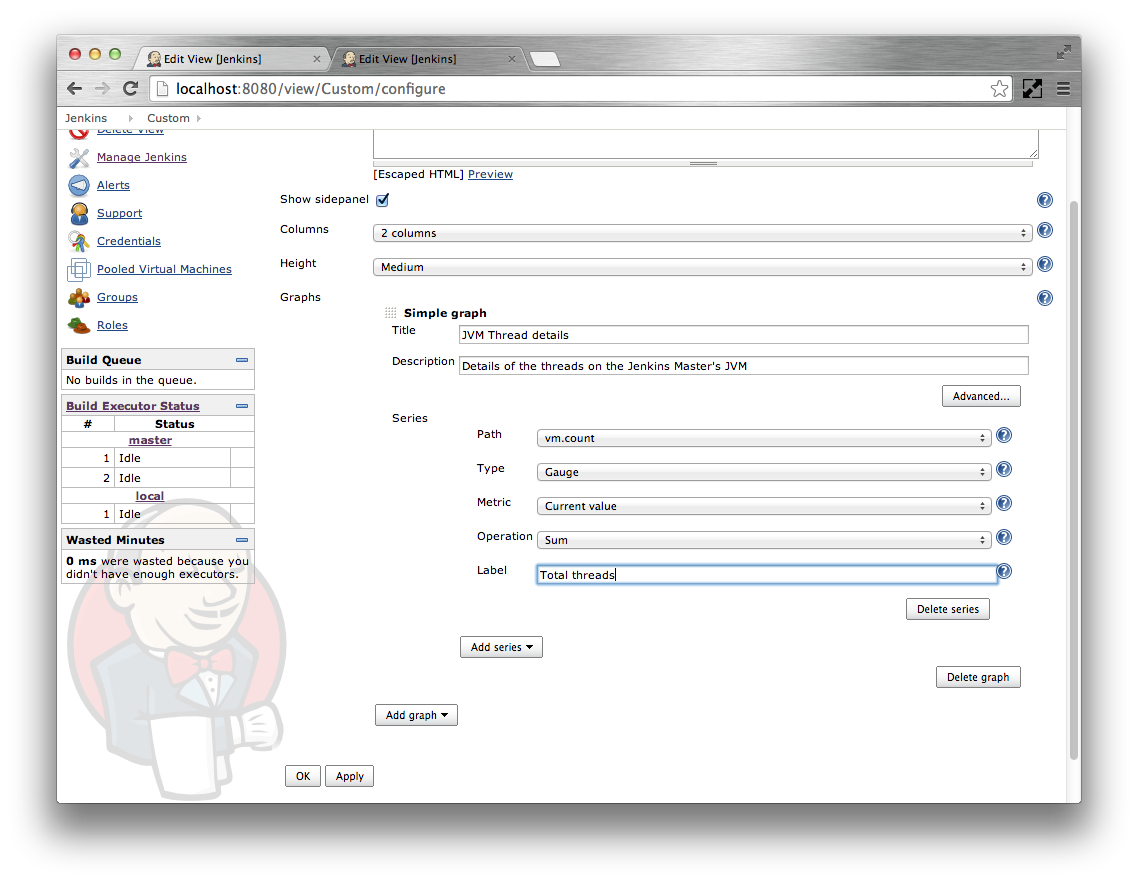
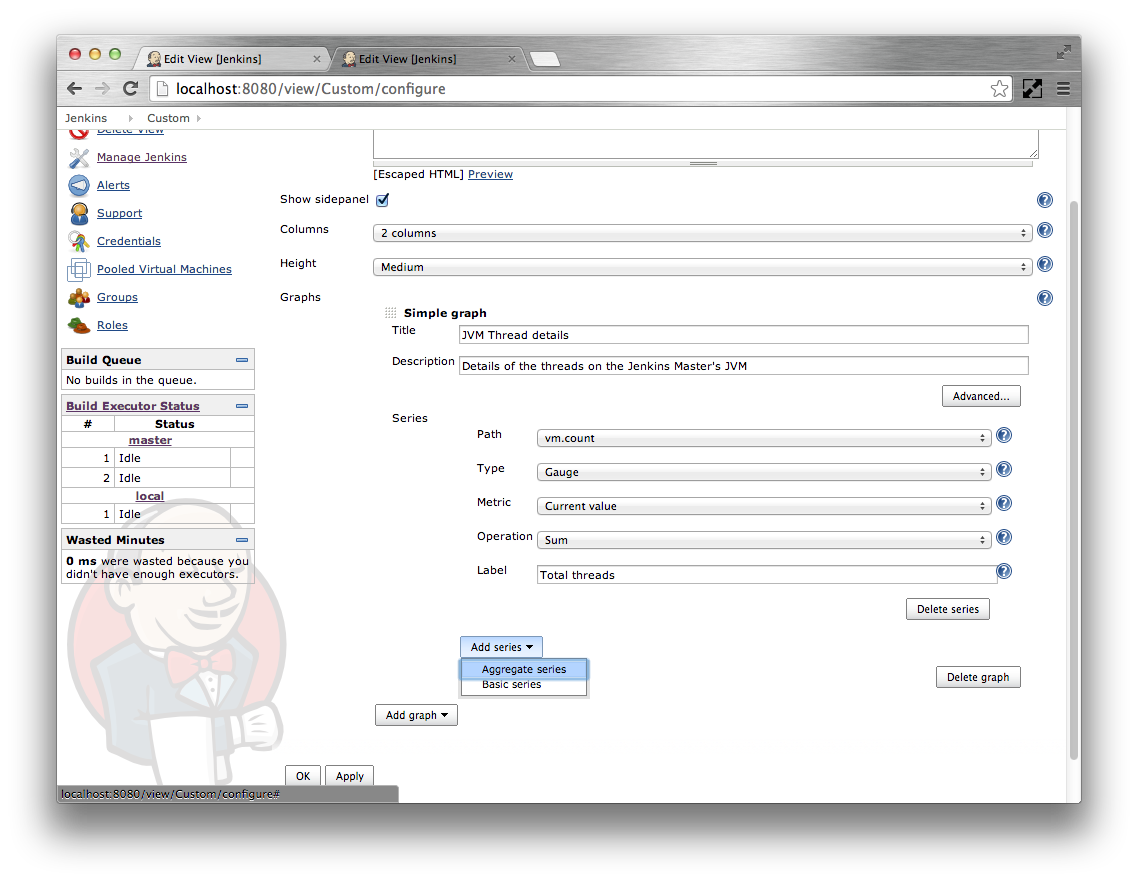
Click the Add series and select Aggregate series
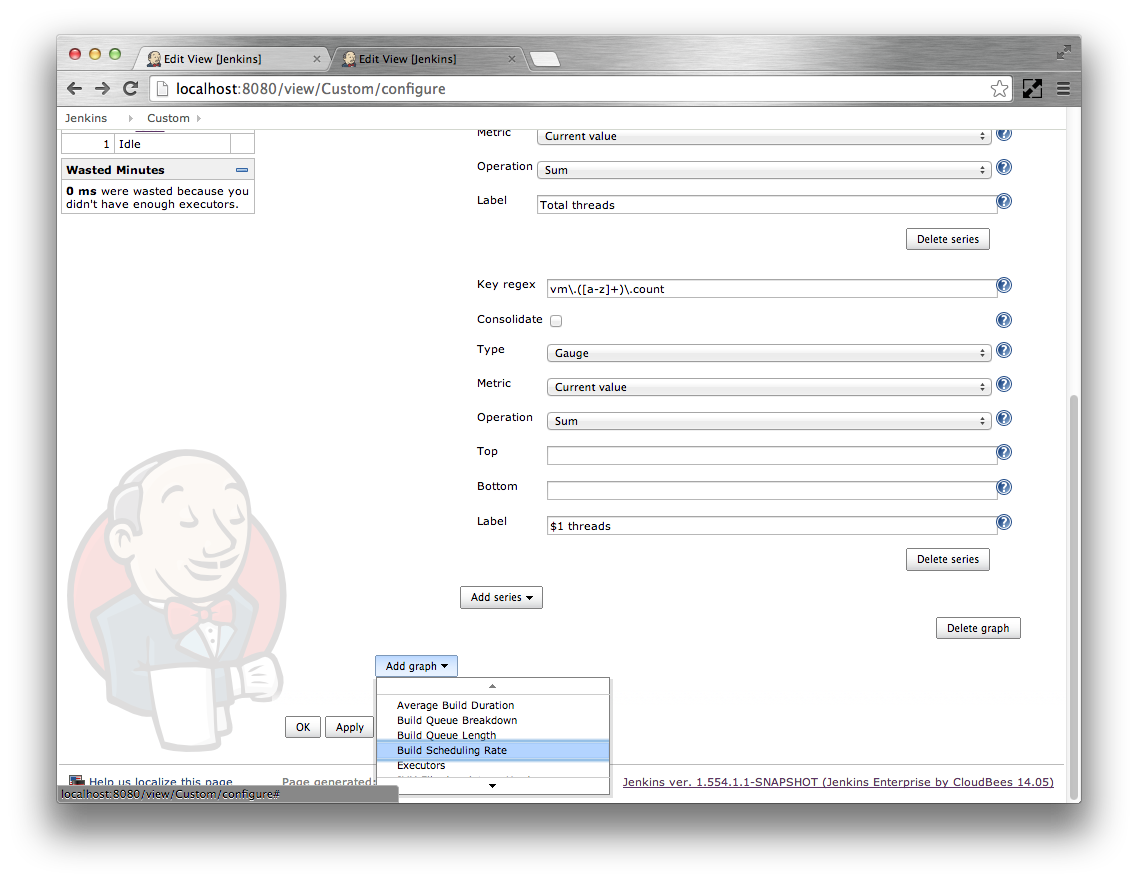
Set the Key regex to
vm\.([a-z]+)\.count. This is the regex that will be used to match metrics.Consolidate if selected will aggregate the matching paths using the aggregatingOperation. If de-selected then each metric will get its own trend line.
The Type cannot be auto-detected when using a regex, so you need to esnure that it is correctly configured for the type of metric that will be matched. In this case the metrics such as
vm.blocked.countare all Gauge.In the situation where there are multiple metric types at the same path, the drop down can be used to select the correct metric type. The Metric allows selecting the specific metric to plot. For gauges there is only one metric. See the section called “Standard metrics” for a description of the different metric types and the metrics they record.
If there are lots of metrics that match the regex, you can limit the number of trend lines that are displayed using the Top and Bottom options. If either or both of these options are specified then up to the specified number of metrics with either the largest or smallest values respectively will be given trend lines. These options have no effect if Consolidate is selected.
The Label is the label to use on the graph’s legend. Groups from the Key regex can be referenced unless Consolidate is selected. In this case we will use
$1 threadsso that the matching group from the regex is used to help label the trend graphs.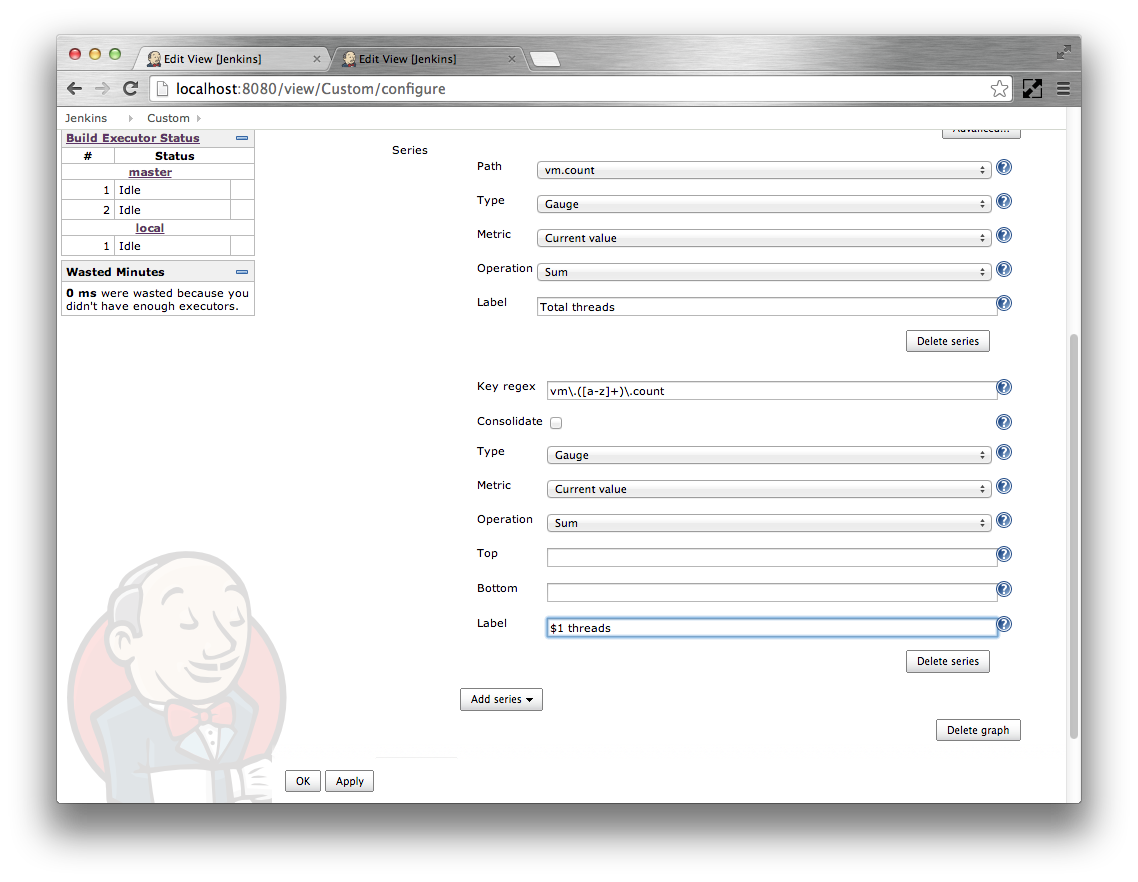
Click the Add graph button and select the Build Scheduling Rate option. This corresponds to the pre-canned graph Build Scheduling Rate graph from the standard metrics dashboard.
Click on the
Okbutton.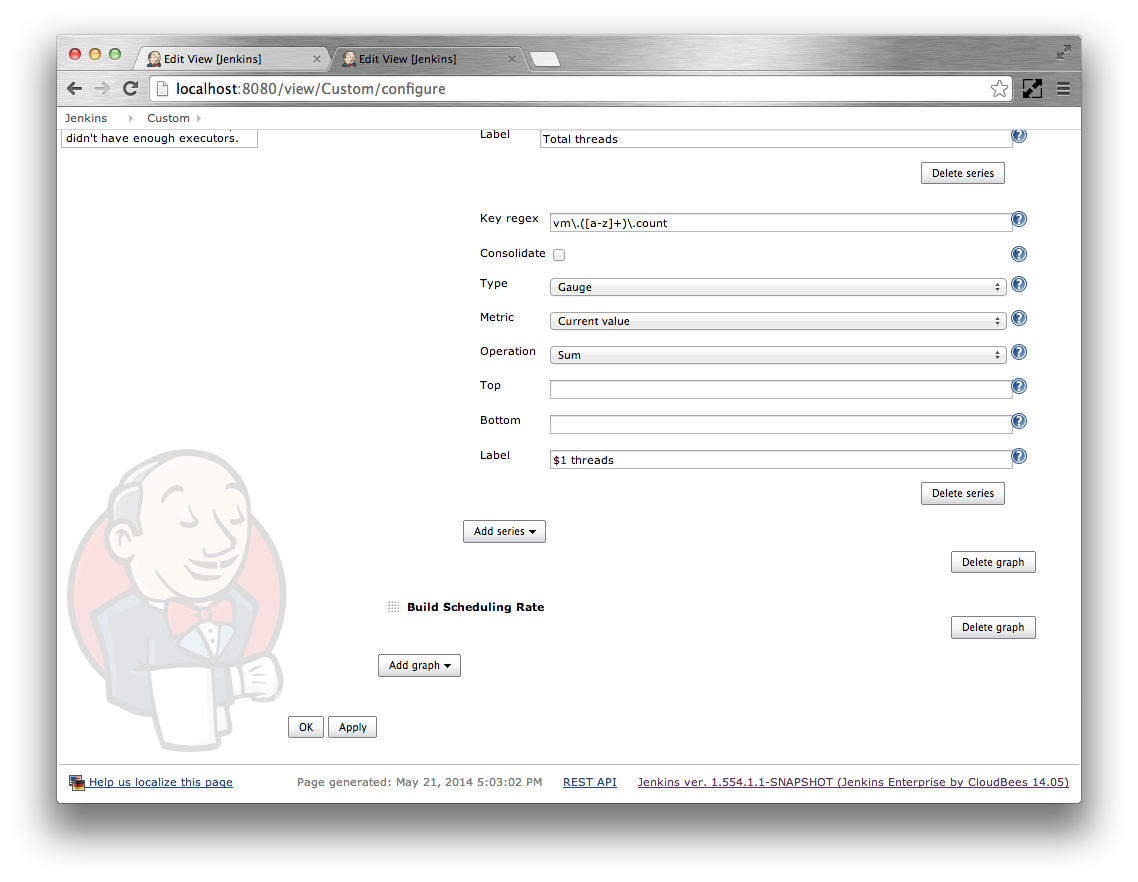
The custom dashboard view should be displayed.