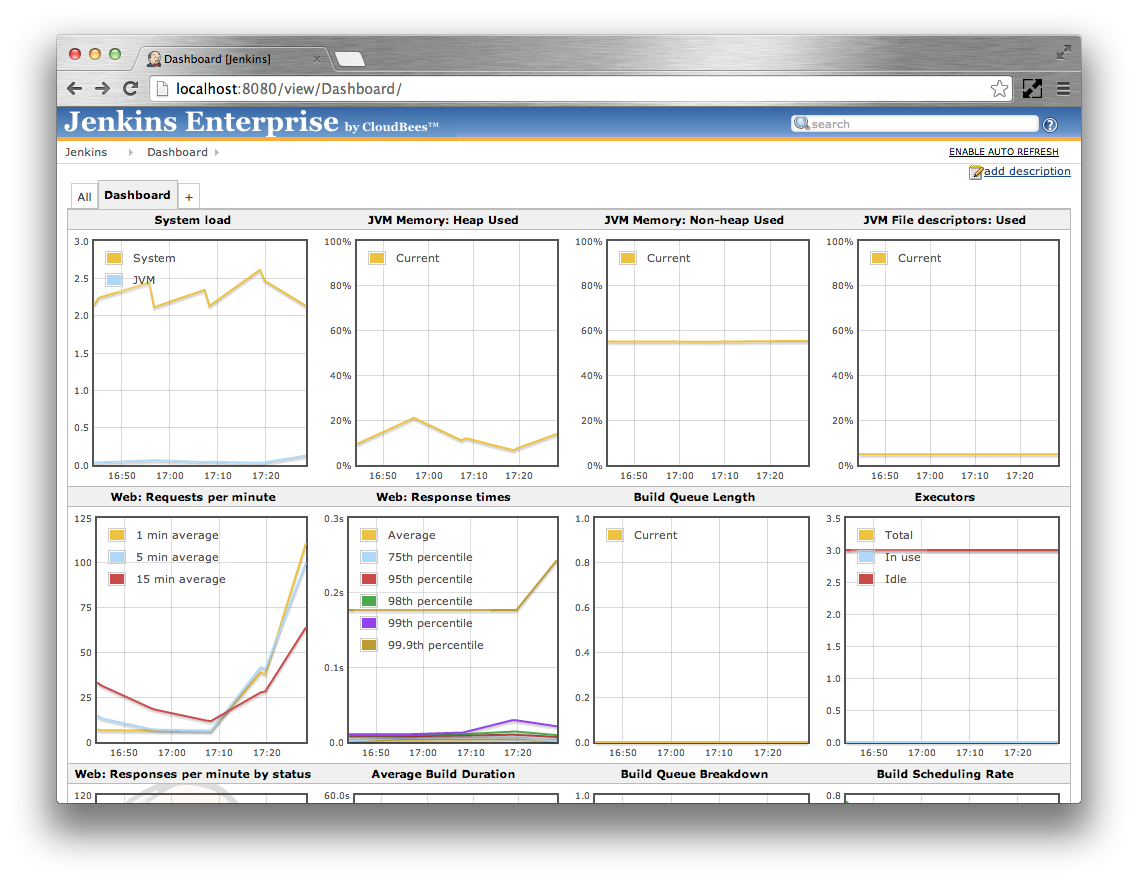
The CloudBees Monitoring plugin provides a standard dashboard view that displays twelve of the more important metrics about a Jenkins installation:
The system load on the master as well as the number of CPU cores in use by the JVM on the master.
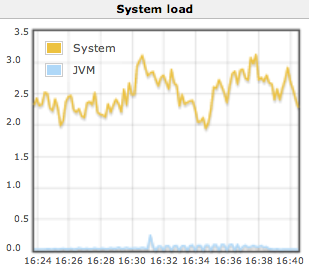
This graph should be compared with the number of CPU cores on the Jenkins master.
The percentage of the master’s JVM’s heap memory pool that is currently in use
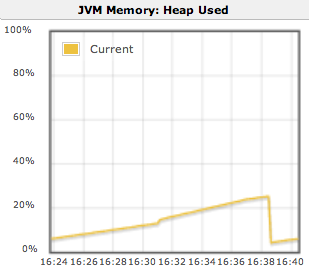
Typically this will be a saw-tooth pattern for a steady state load. The graph being consistently above 80% is usually indicative of memory pressure.
The percentage of the master’s JVM’s non-heap memory pool that is currently in use
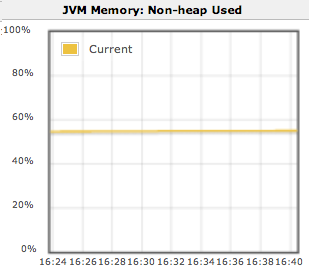
This graph being consistently above 80% is usually indicative of memory pressure.
The percentage of file descriptors in use by the Jenkins master
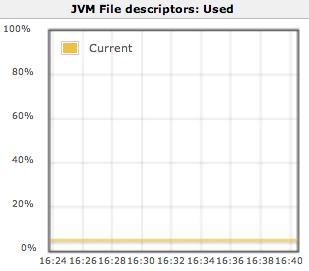
When the Jenkins master is running on a Unix-based operating system this should remain consistently low unless there is a file handle leak in one of the plugins installed in your Jenkins master. When Jenkins runs out of file handles jobs can start failing at random.
The rate of web requests against the Jenkins master UI
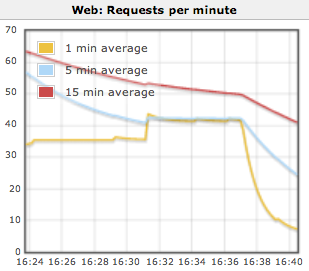
If the web request rate is at or near a limit for your deployment architecture then web requests may start to fail. The exact limit depends on the deployment architecture for your Jenkins master UI.
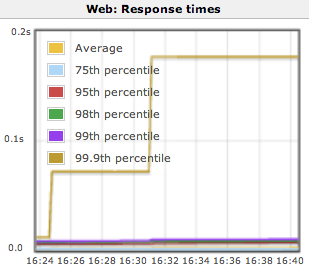
The response time distribution for web requests against the Jenkins master UI
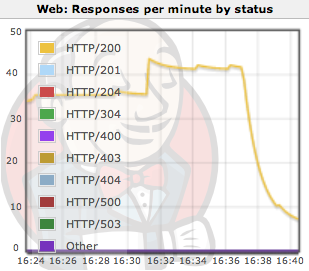
The response status code breakdown for web requests against the Jenkins master UI
The length of the build queue
When there is a mismatch between the build capacity and the rate at which builds are being scheduled this metric provides a key indicator.
The amount of time a build takes to complete, including a breakdown for time spent queuing
Jobs are spending a large portion of time in the build queue, is an indicator of a Jenkins master that needs more build slaves.
The breakdown of the build queue based on the various reasons why a job can be in the build queue
A job is considered stuck if any of the following conditions is true: There are no build nodes with the labels required by the job The job is waiting for more than 10 times its estimated duration to build but all the nodes that it can build on are busy ** The job has never been built and is waiting for more than a day to build but all the nodes that it can build on are busy
The executors available for building jobs
The rate at which build jobs are scheduled
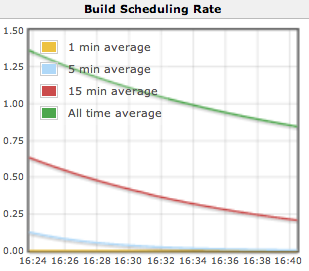
If a job is already in the queue and an identical request for scheduling the job is received then Jenkins will coalesce the two requests. Thus it can be normal for the scheduling rate to be higher than the build rate.
The standard metrics dashboard has the advantage that it does not support customization and as a result requires very little effort to set up.
The following instructions will add a standard metrics dashboard view to the root of Jenkins. You can also add the dashboard to folders or other view container, though as the dashboard is not contextual the same information will be displayed.
If your Jenkins instance has some jobs, just click on the
+tab on the top of the jobs list in Jenkins to get to the new view screenIf your Jenkins does not have any jobs yet, change the browser URL from
JENKINS_URL/toJENKINS_URL/newView- Enter a name for your new view, such as
Dashboard. Select the Jenkins Enterprise Metrics Dashboard radio button.
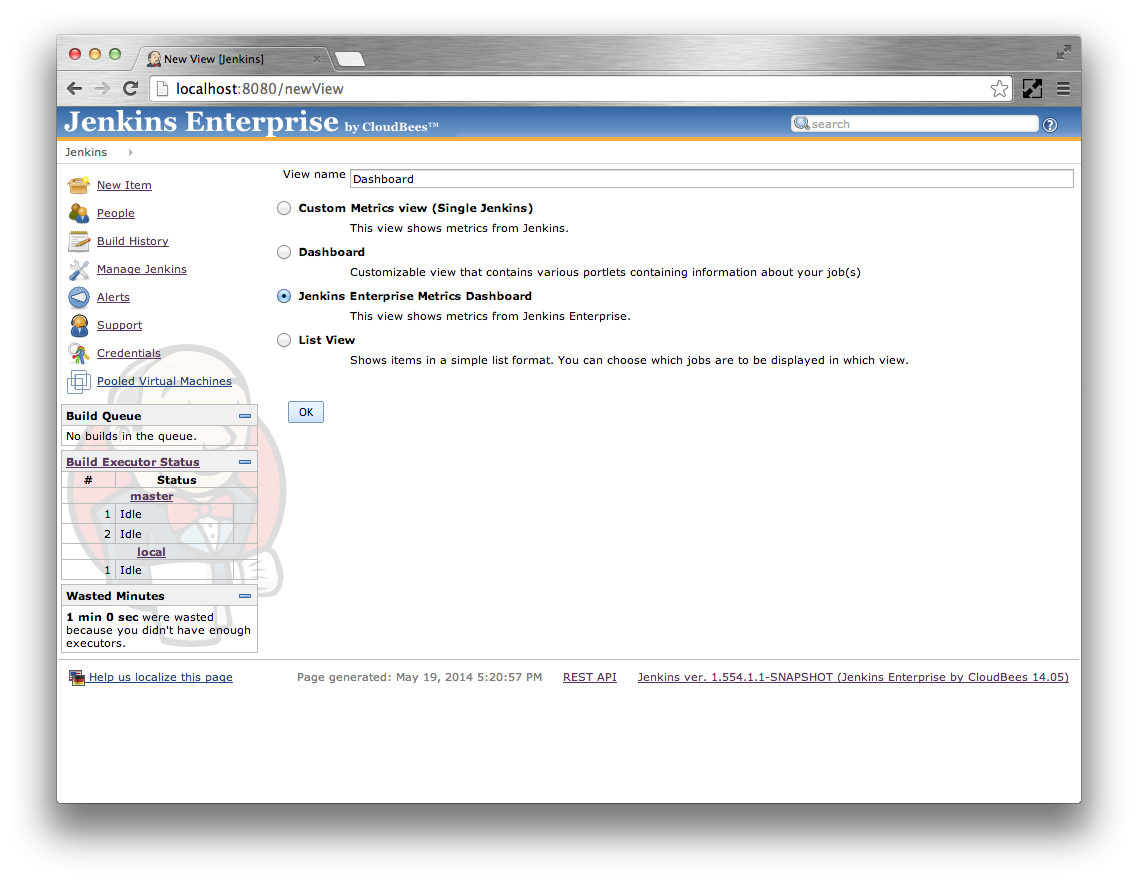
- Click on the
Okbutton. The view configuration screen should be displayed. There are only two options available for configuration on this screen: the view name and the view description. Click the
Okbutton to finish creating the view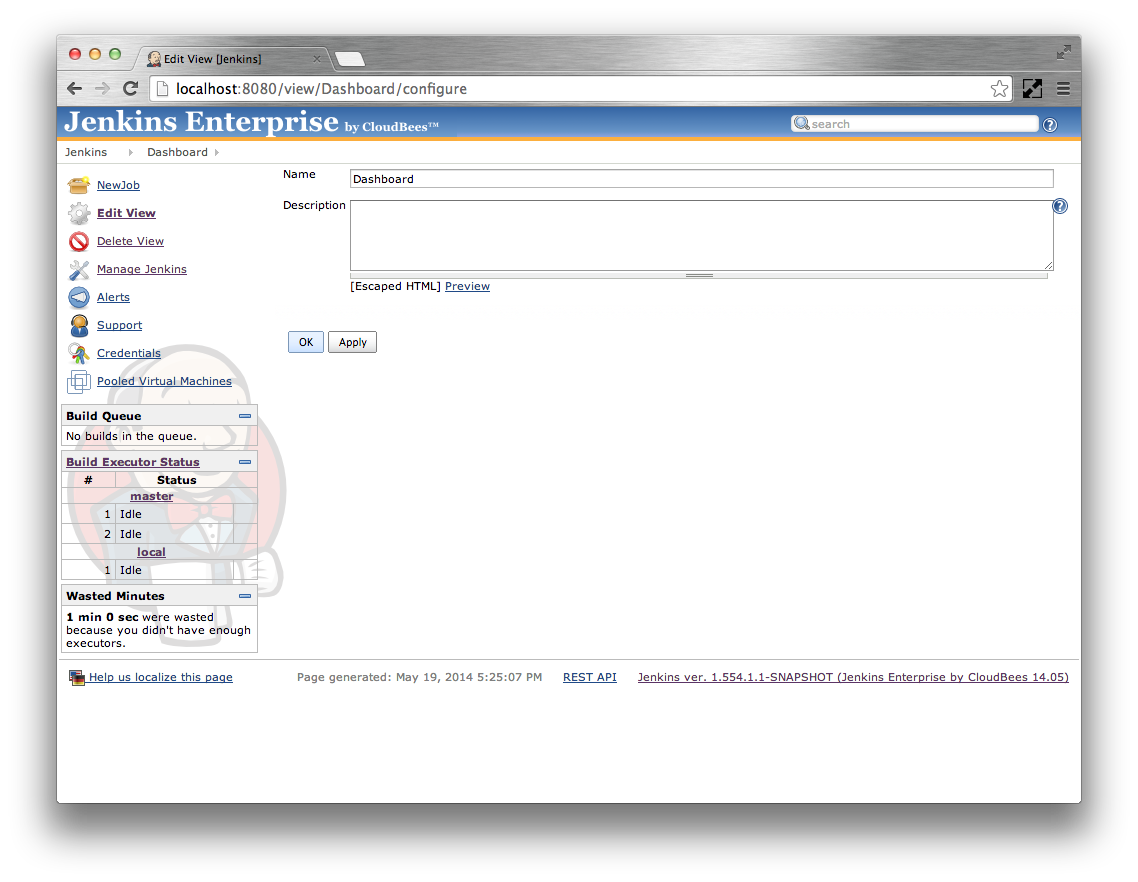
You should now have a standard metrics dashboard view. When initially displayed the dashboard will progressively load the historical metrics maintained by the metrics plugin since Jenkins started. Once the historical data has been loaded the graphs will switch to live updating mode where they are updated every 10 seconds.
 |
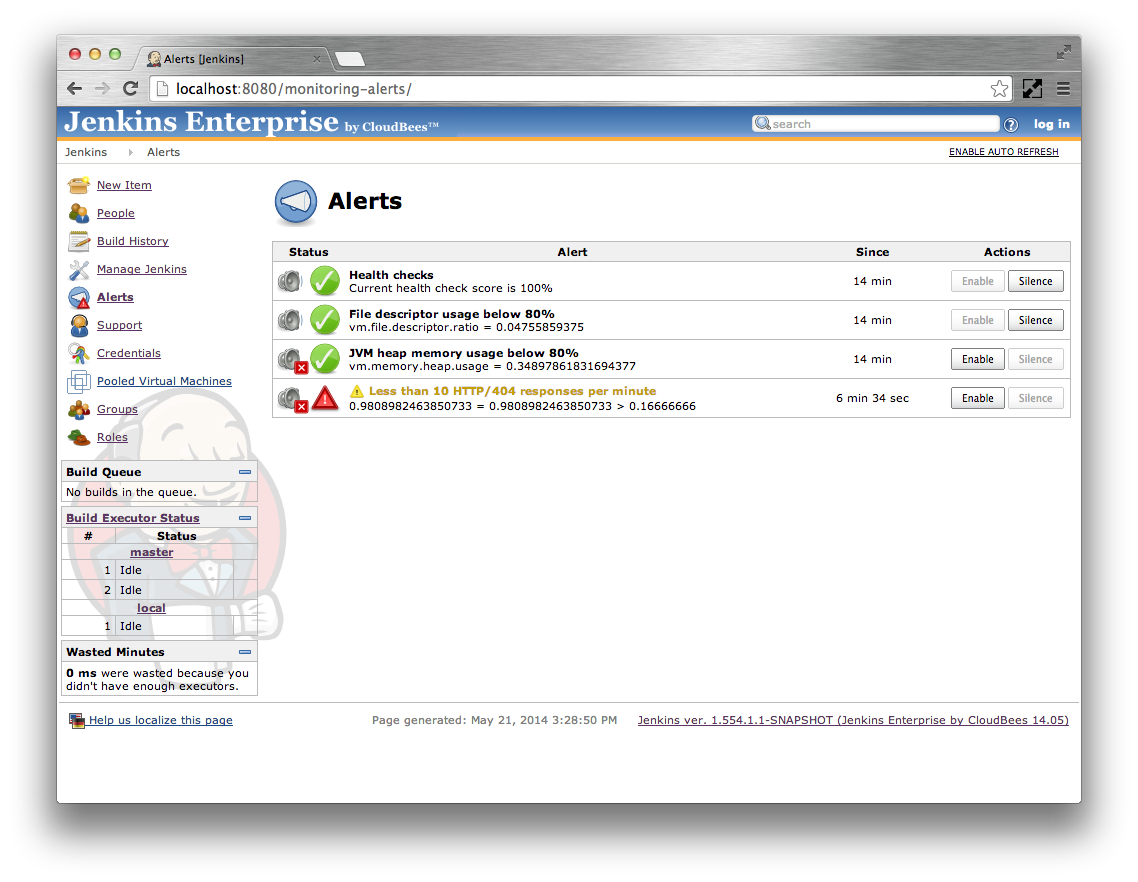
This feature allows you to define different metrics based alerts and have Jenkins send emails when the alerts start and finish
When the feature is enabled it adds an Alerts action to the top level Jenkins actions. The Alerts action allows viewing the status of all the defined alerts as well as providing the ability to silence specific alerts.
Note
In order for the alerting via email to function, Jenkins must be configured to be able to send emails
The following instructions will create four basic alerts:
- An alert that triggers if any of the health reports are failing
- An alert that triggers if the file descriptor usage on the master goes above 80%
- An alert that triggers if the JVM heap memory usage is over 80% for more than a minute
- An alert that triggers if the 5 minute average of HTTP/404 responses goes above
10per minute for more than five minutes
These instructions assume you have configured Jenkins with the SMTP settings required for sending emails.
Login as an administrator and navigate to the main Jenkins configuration screen.
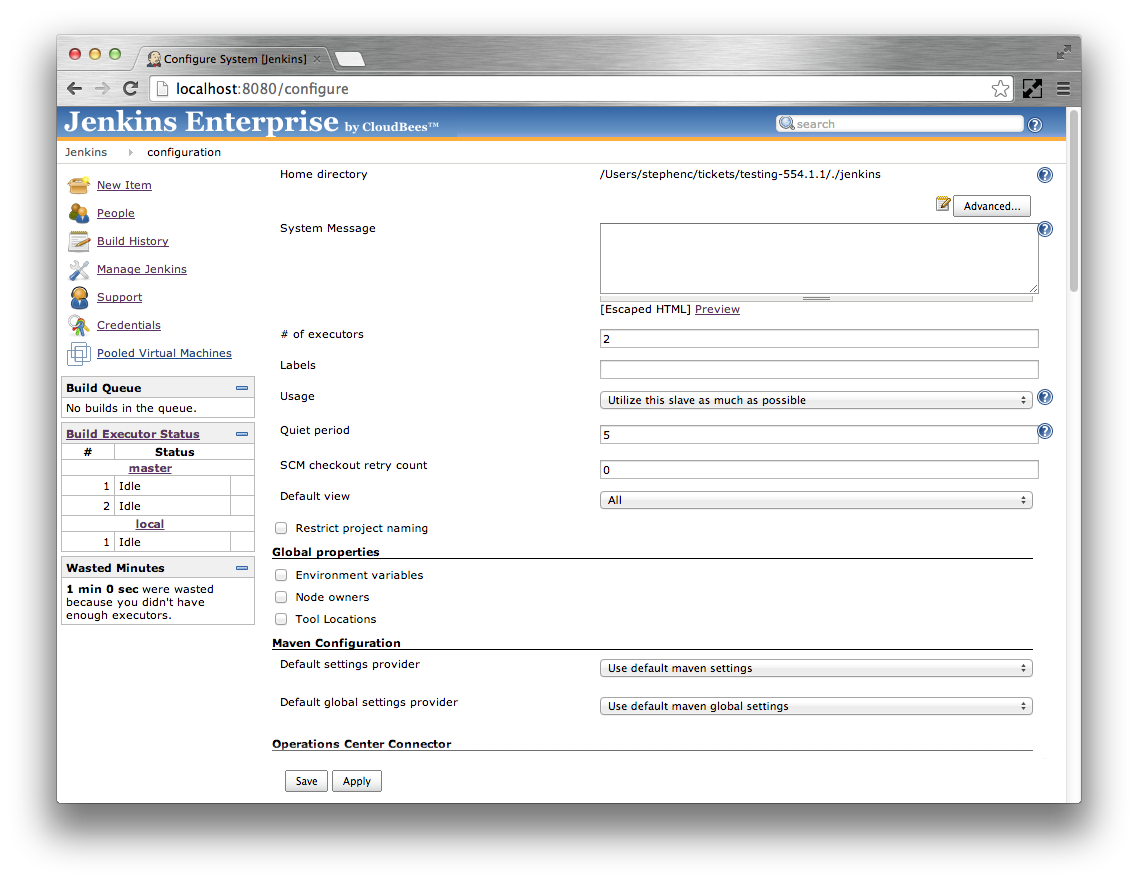
Scroll down to the Alerts section.
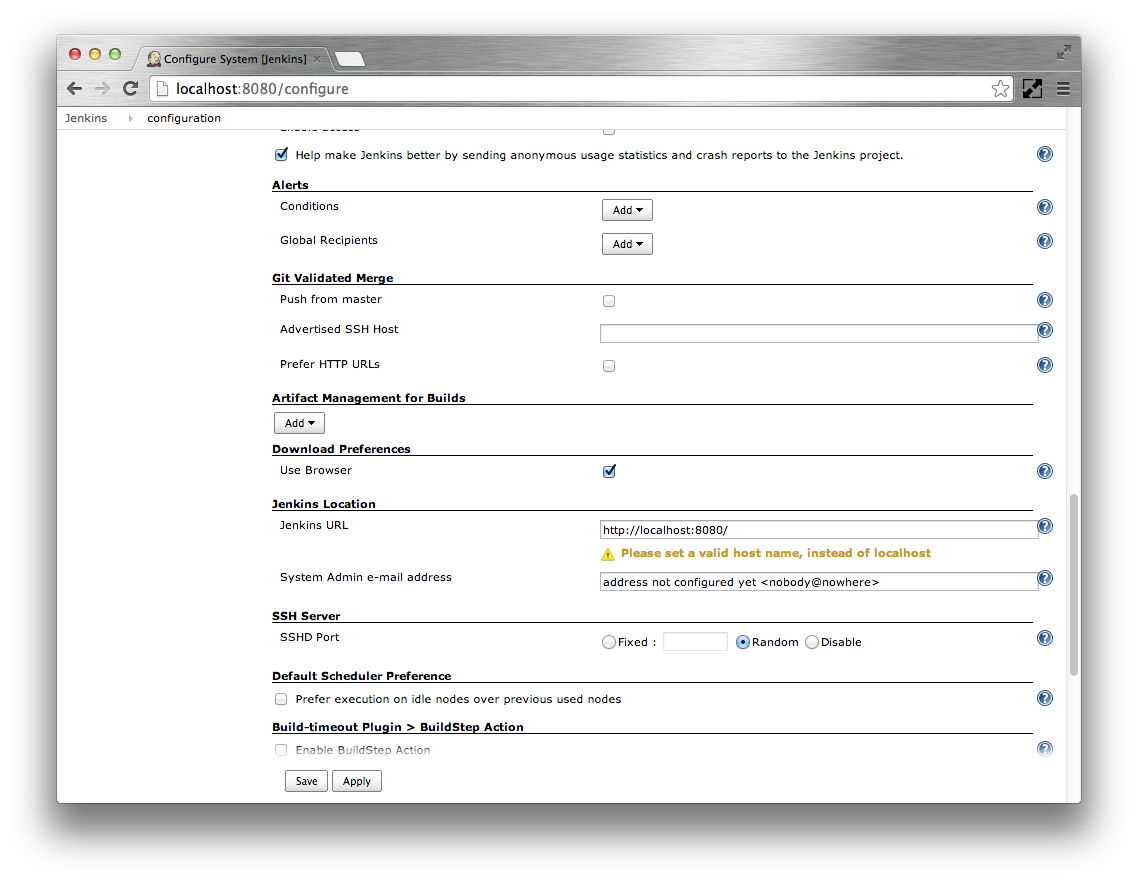
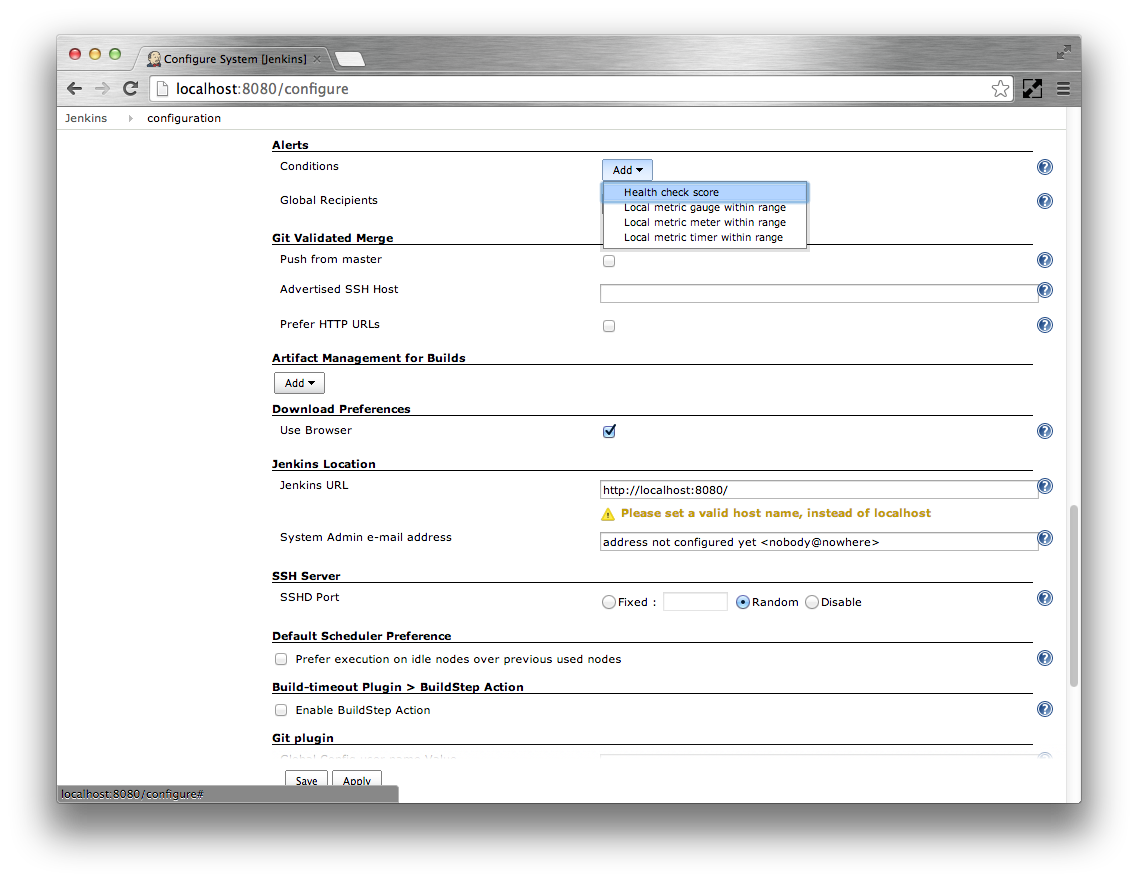
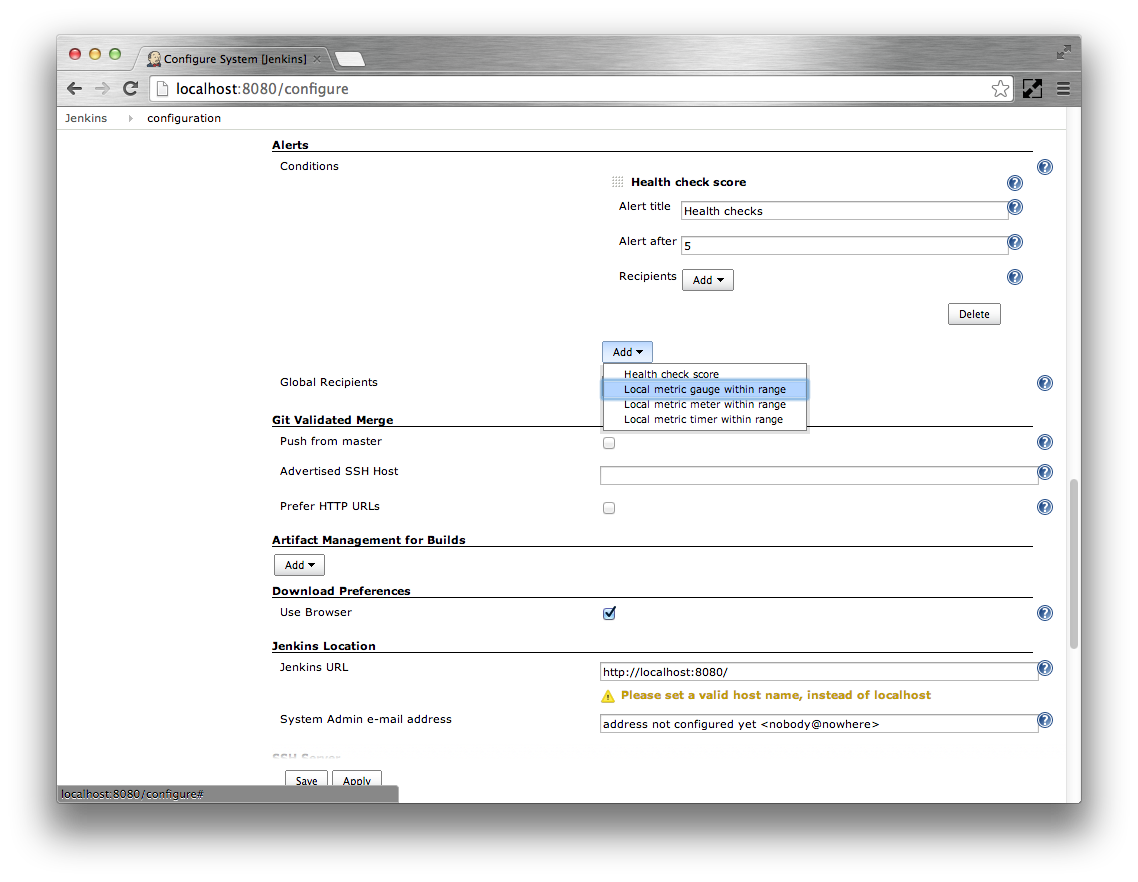
- Click the Add corresponding to the Conditions
Select the Health check score option
Specify
Health checksas the Alert title. Leave the Alert after at5seconds. If you want to specify additional recipients for this health check only you can add them. Emails will be sent to the Global Recipients as well as any alert specific Recipients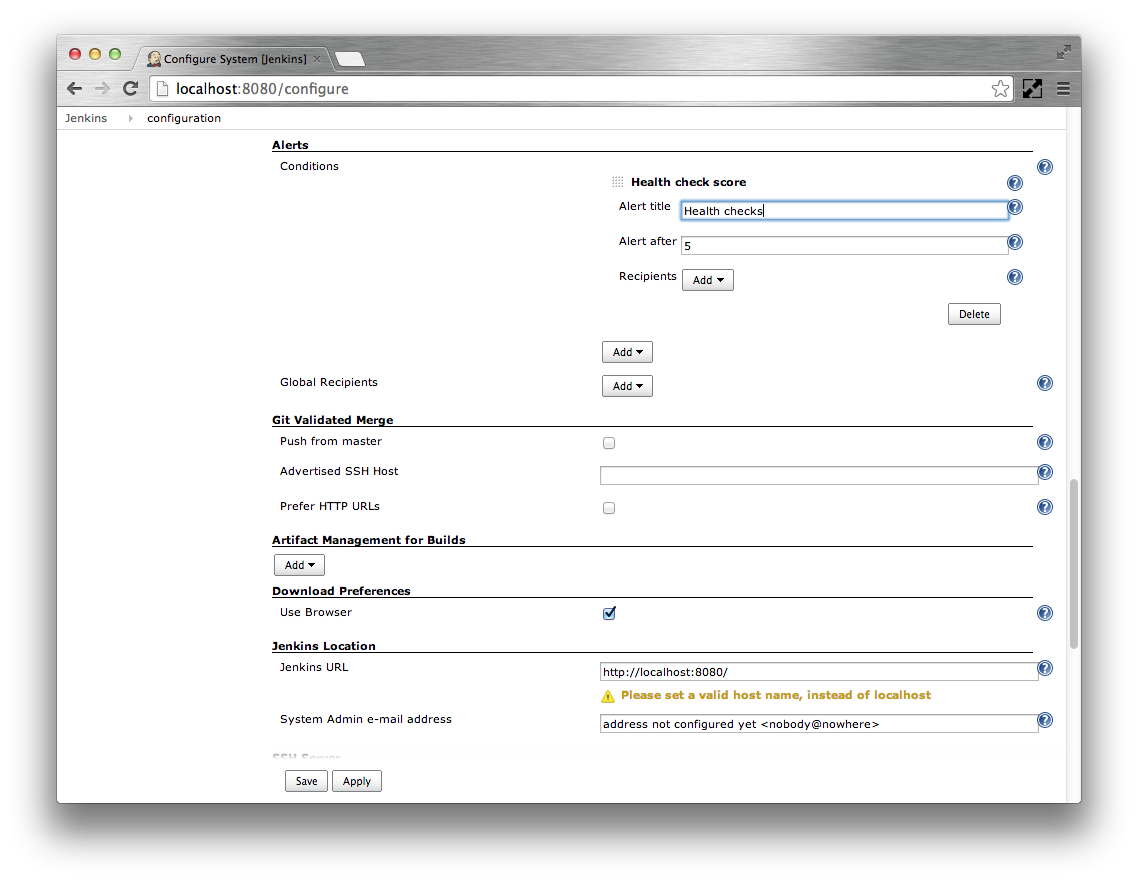
- Click the Add corresponding to the Conditions
Select the Local metric gauge within range option
Specify
vm.file.descriptor.ratioas the Gauge. Specify0.8as Alert if above. SpecifyFile descriptor usage below 80%as the Alert title. Leave the Alert after at5seconds.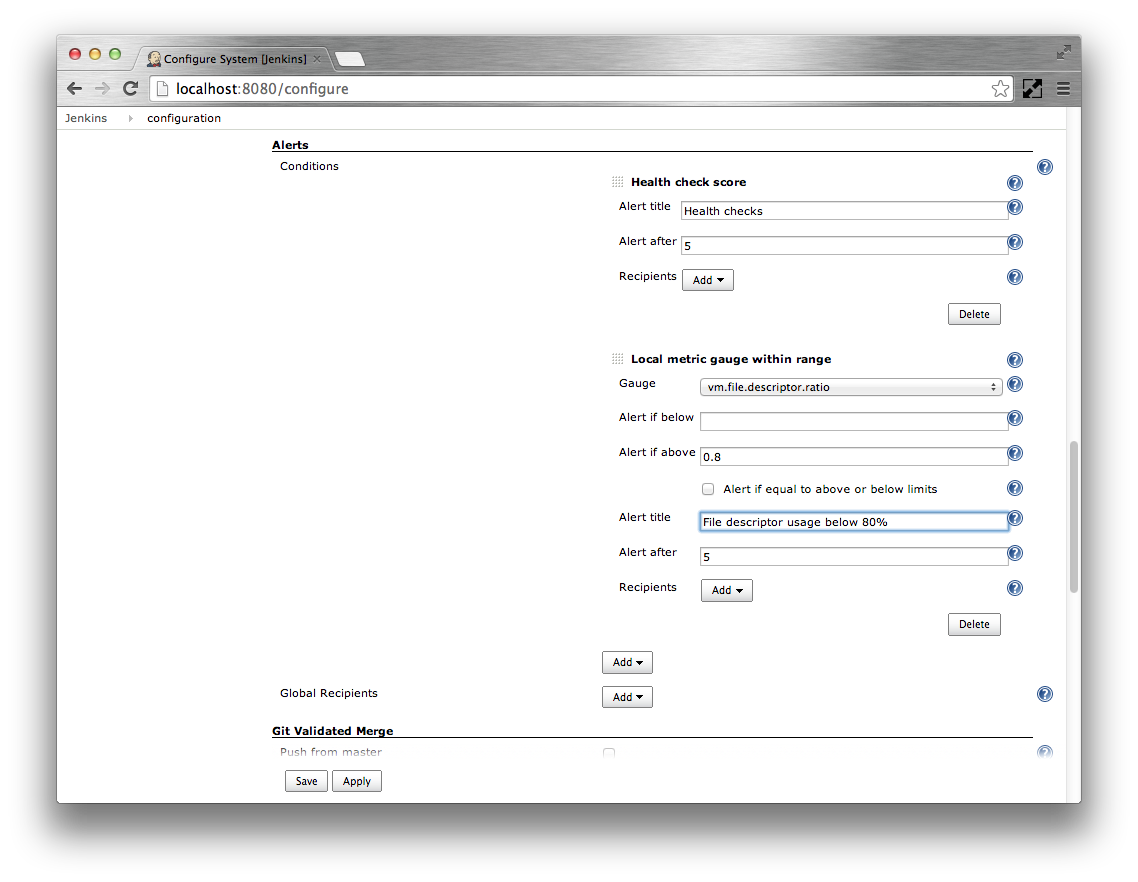
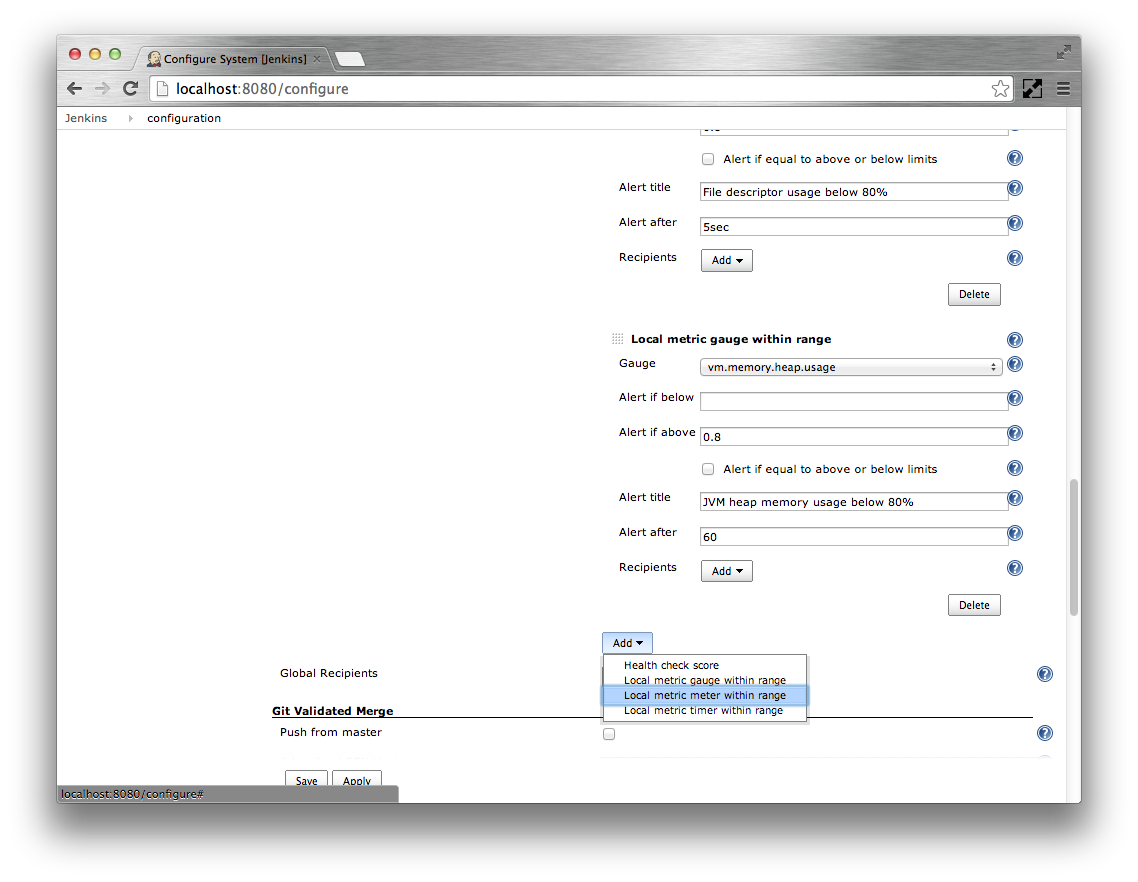
- Click the Add corresponding to the Conditions
Select the Local metric gauge within range option
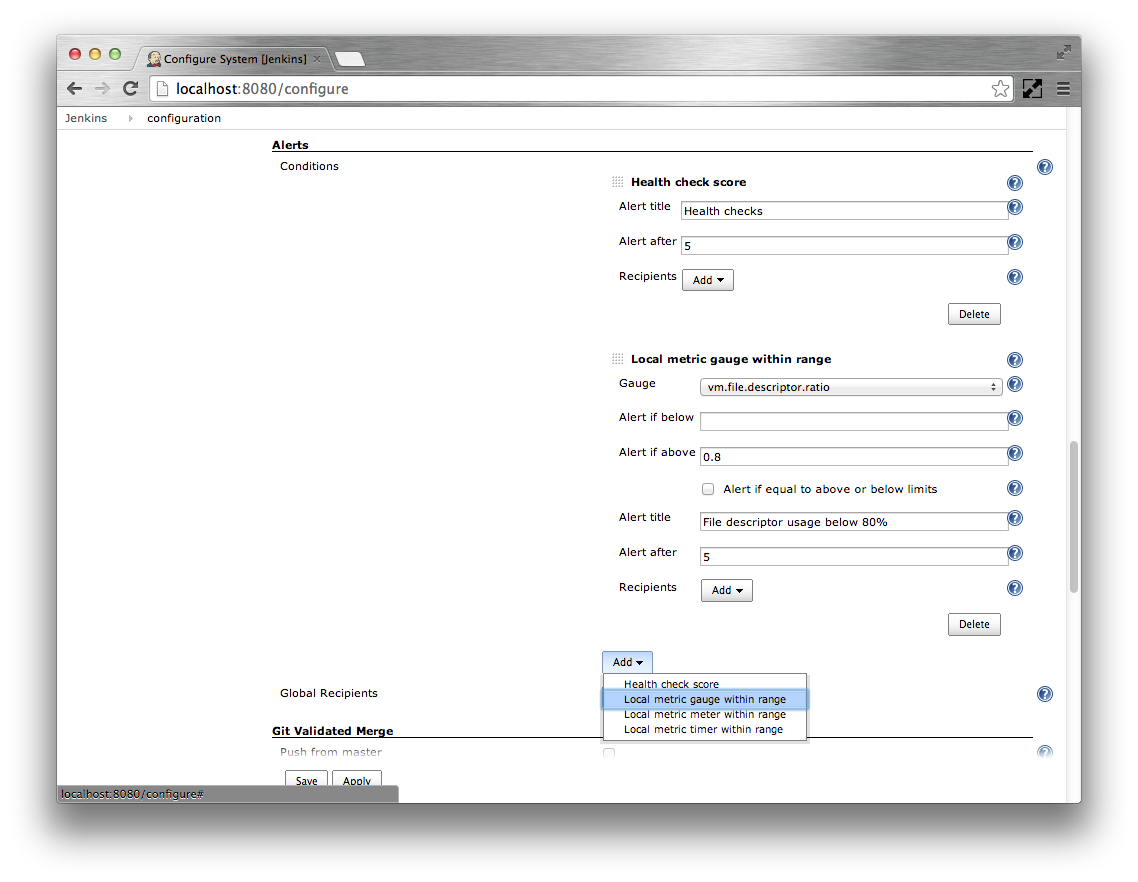
Specify
vm.memory.heap.usageas the Gauge. Specify0.8as Alert if above. SpecifyJVM heap memory usage below 80%as the Alert title. Specify the Alert after as60seconds.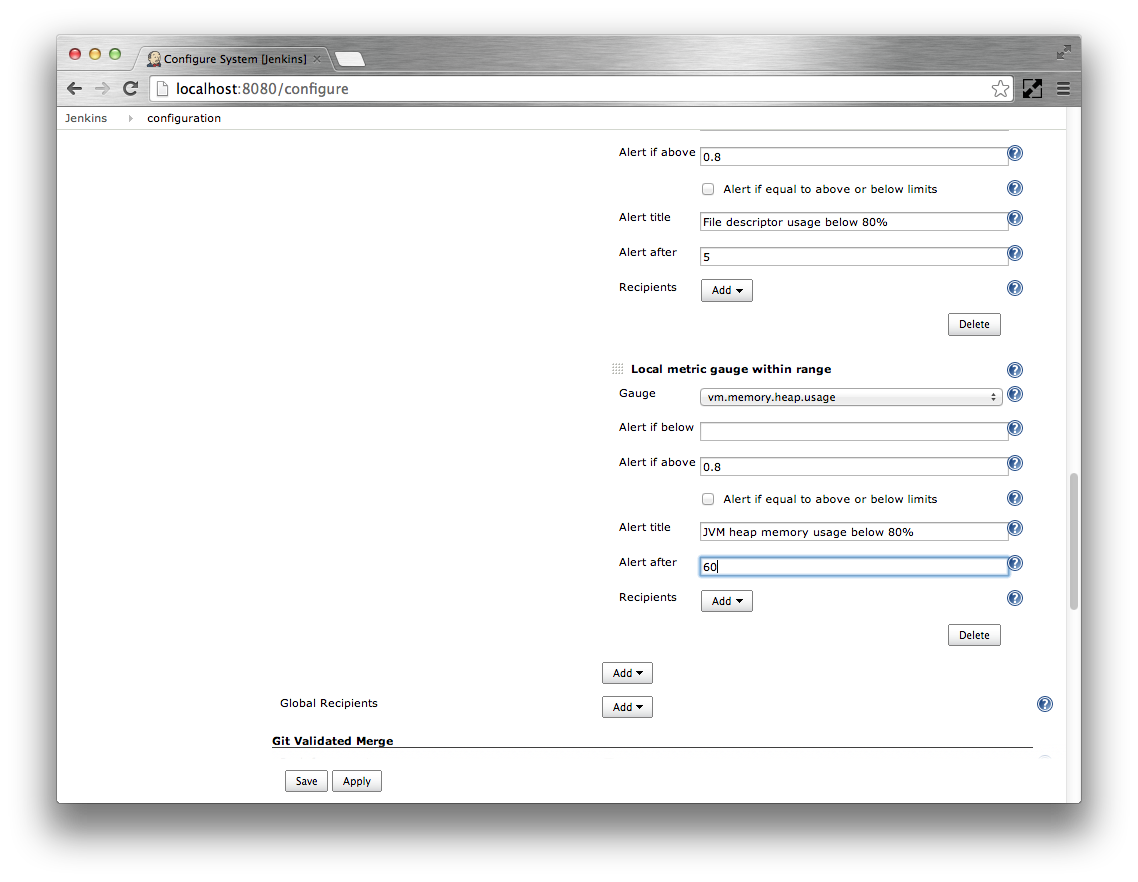
- Click the Add corresponding to the Conditions
Select the Local metric meter within range option
Specify
http.responseCodes.badRequestas the Meter. Specify5 minute averageas the Value. Specify0.16666666as Alert if abovethe meter rates all report in events per second. Specify
Less than 10 bad requests per minuteas the Alert title. Specify the Alert after as300seconds.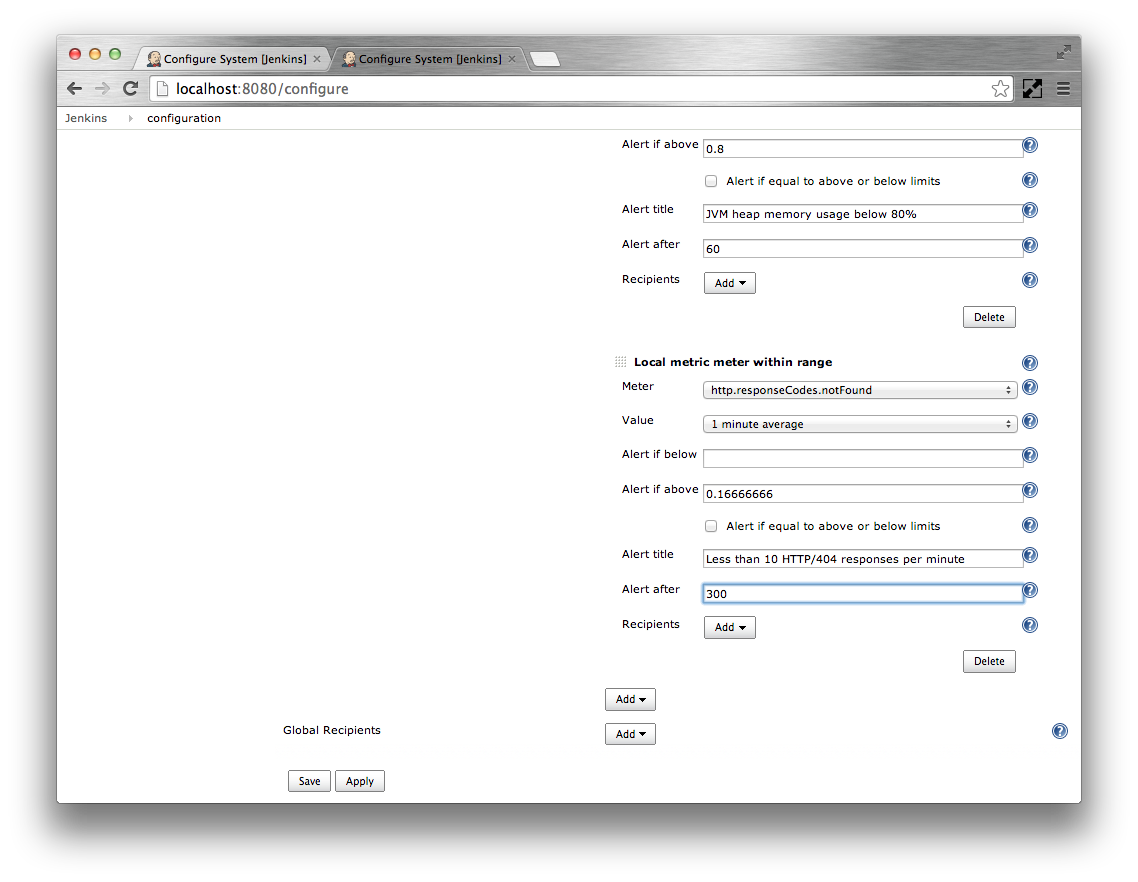
- Click the Add corresponding to the Global Recipients
Select the Email notifications option
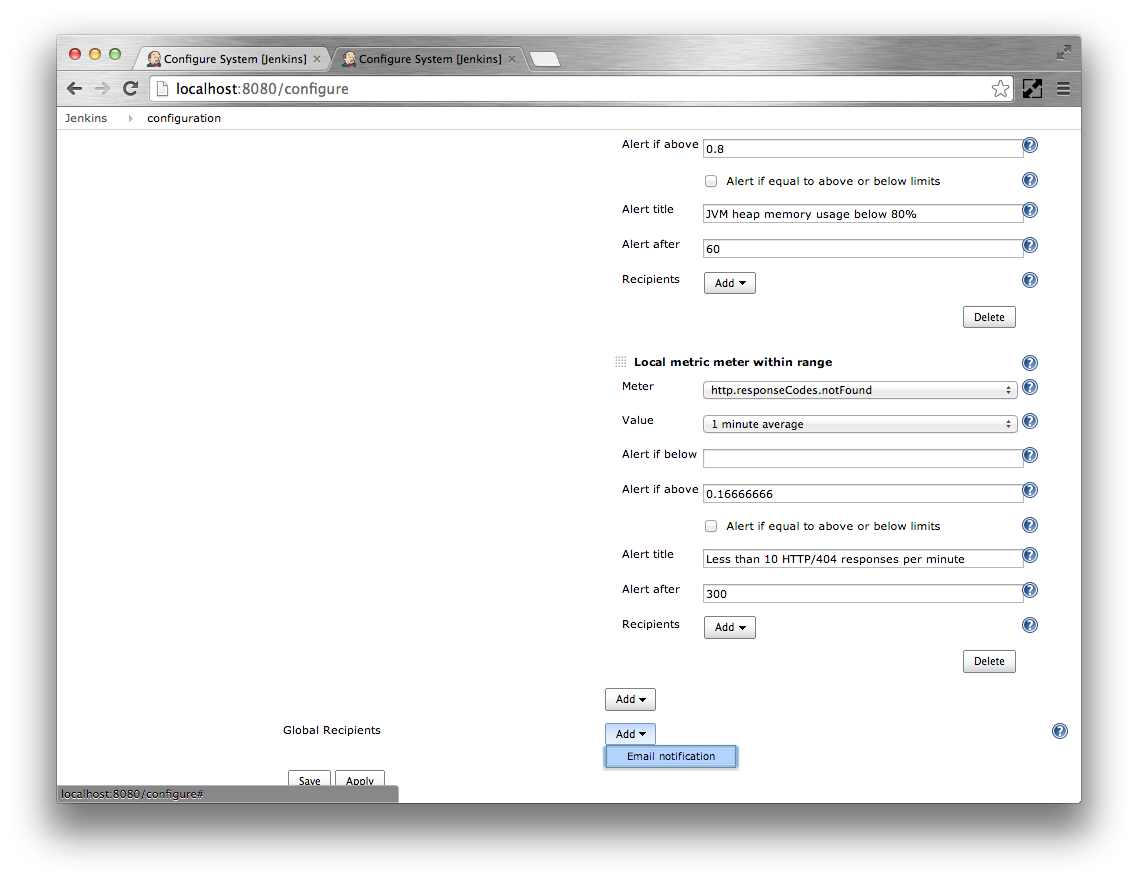
Specify the alert email recipients as a whitespace or comma separated list in the Email addresses text box.
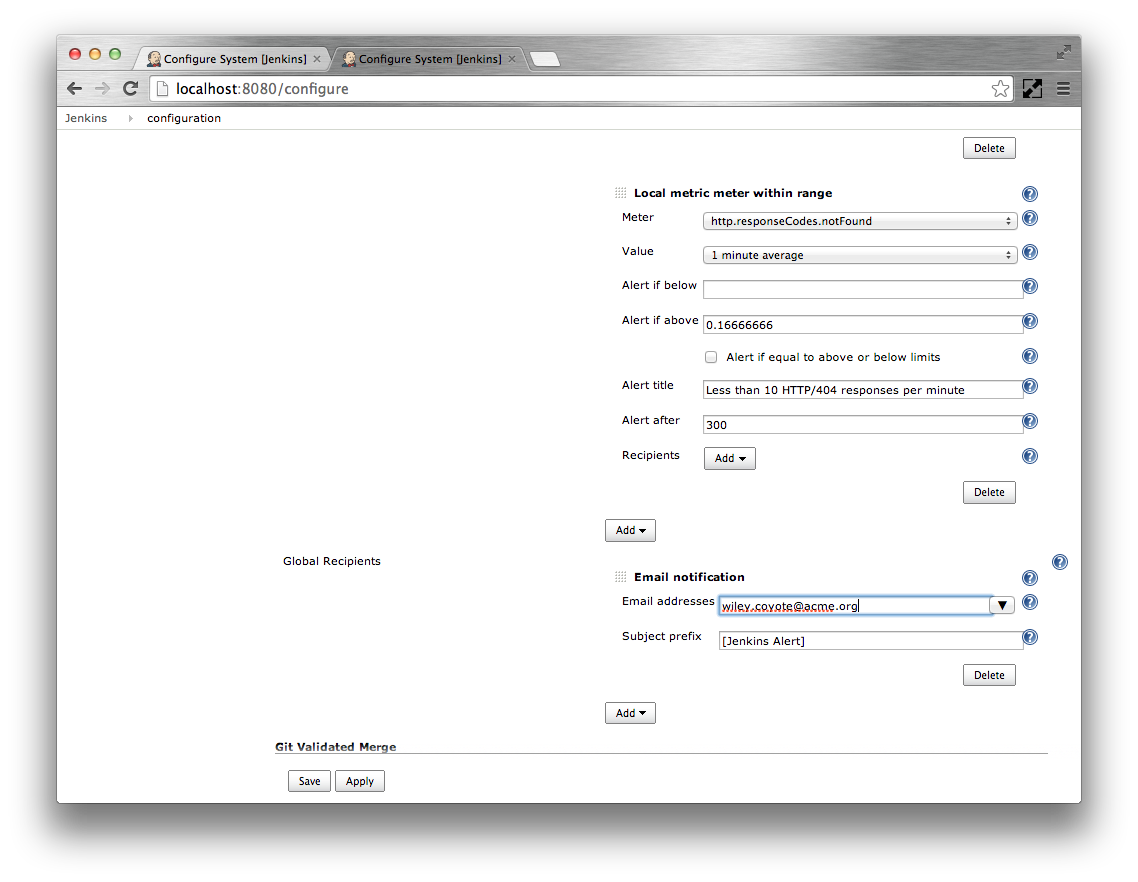
- Save the configuration.
The main Jenkins root page should now have an Alerts action. Click on this action to view the alerts
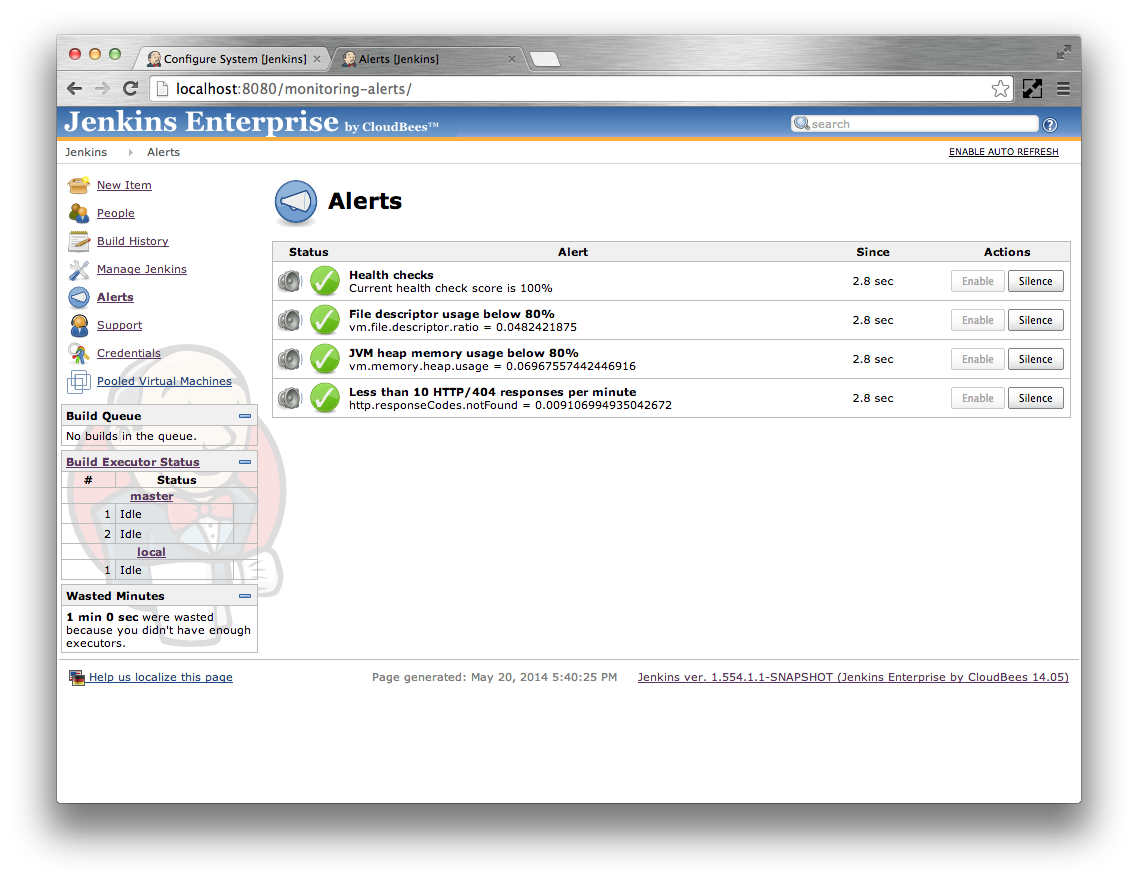
Each alert can be in one of four states:
Table 24.1. Alert states
| Icon | State | When |
|---|---|---|
|
Failing |
The alert condition is met for less than the Alert after duration |
|
Failed |
The alert condition has been met for at least the Alert after duration |
|
Recovering |
The alert condition is not met for less than the Alert after duration |
|
Recovered |
The alert condition is not met for at least the Alert after duration |
Notification emails will be sent for any alarms that are not silenced on either of the transitions:
- Failing to Failed
- Recovering to Recovered
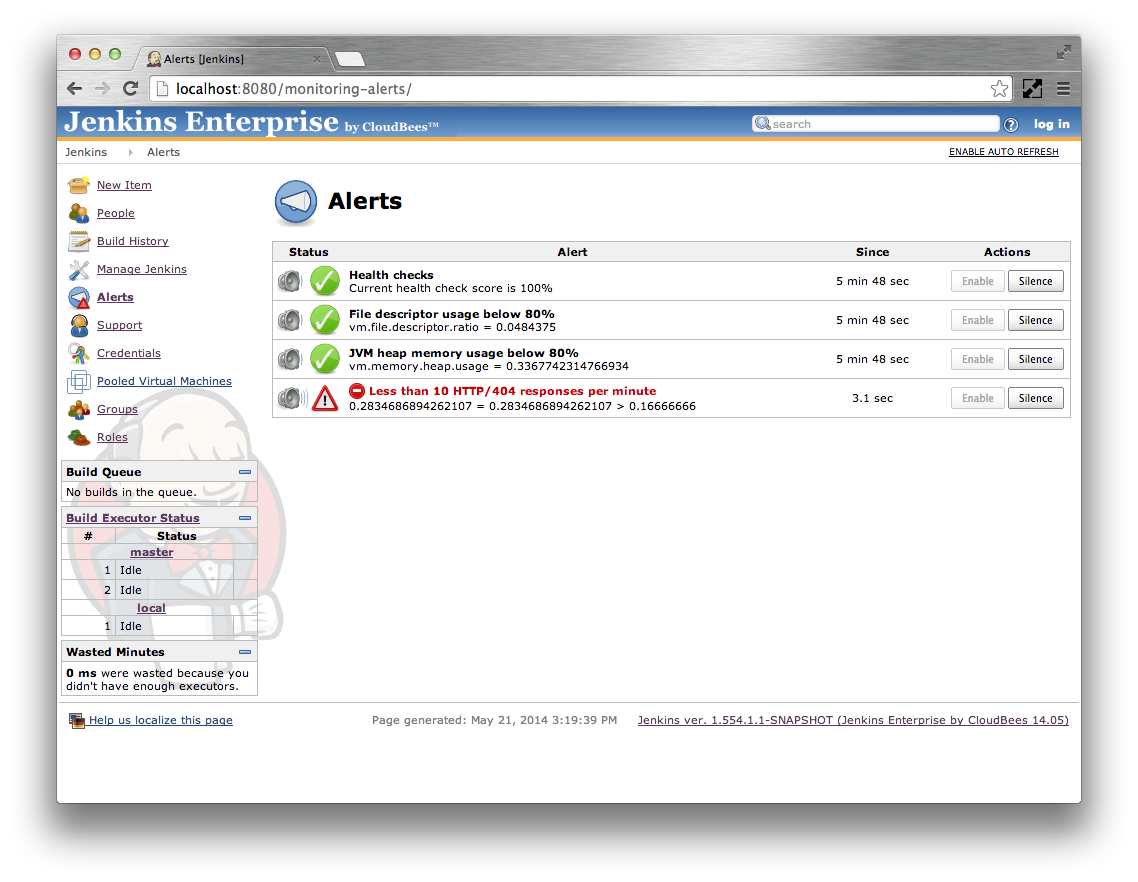
The alerts are checked every 5 seconds. The Alerts page displays the current value of each alert condition. If the condition has changed in between these alert checks then the UI may show the alert in a mixed state such as in Figure 24.2, “An alert where the condition has changed prior to the periodic checks running”.

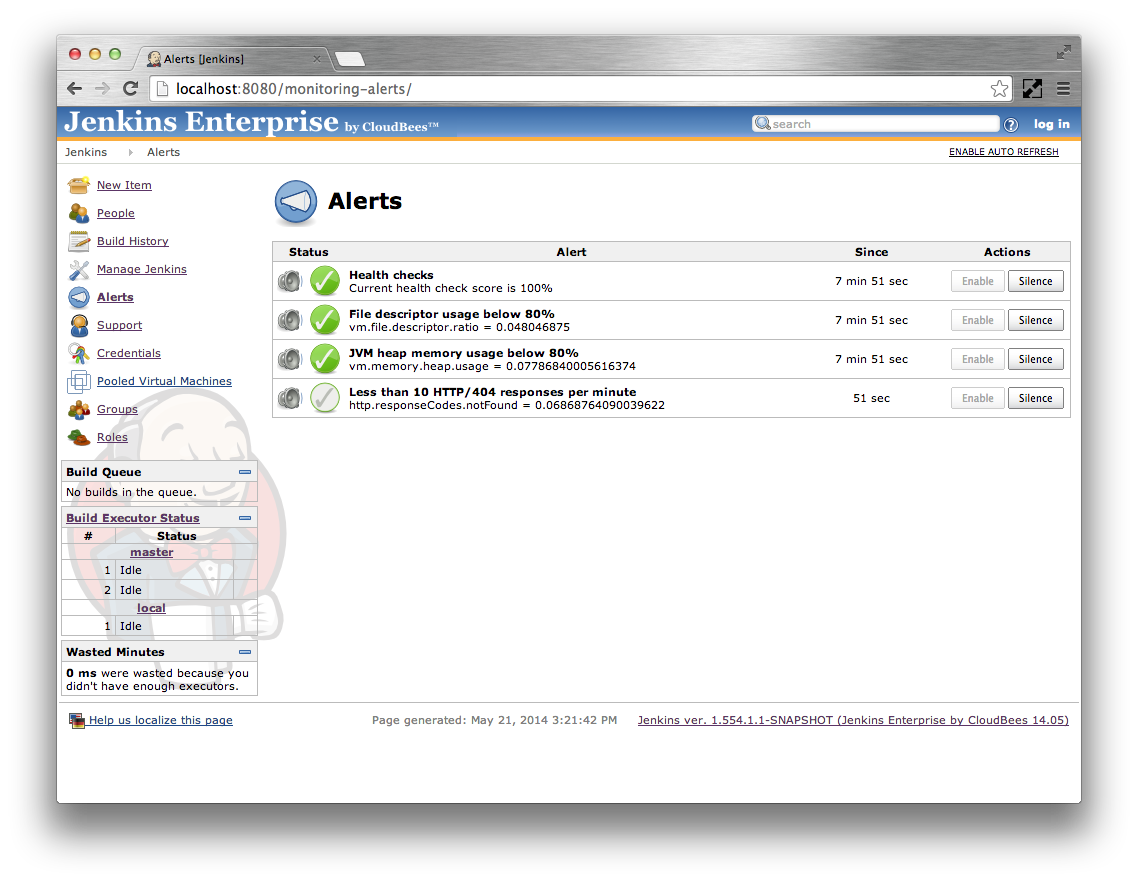
However, once the periodic check runs, the condition will enter either the Failing or Recovering state.
If the condition changes before the condition’s Alert after time expires then no notifications will be sent.
On the other hand, if the condition stays constant for the entire Alert after time then a notification will be sent.
The Silence button can be used to supress the sending of notifications for specific alerts. The alerts are re-enabled using the Enable button.